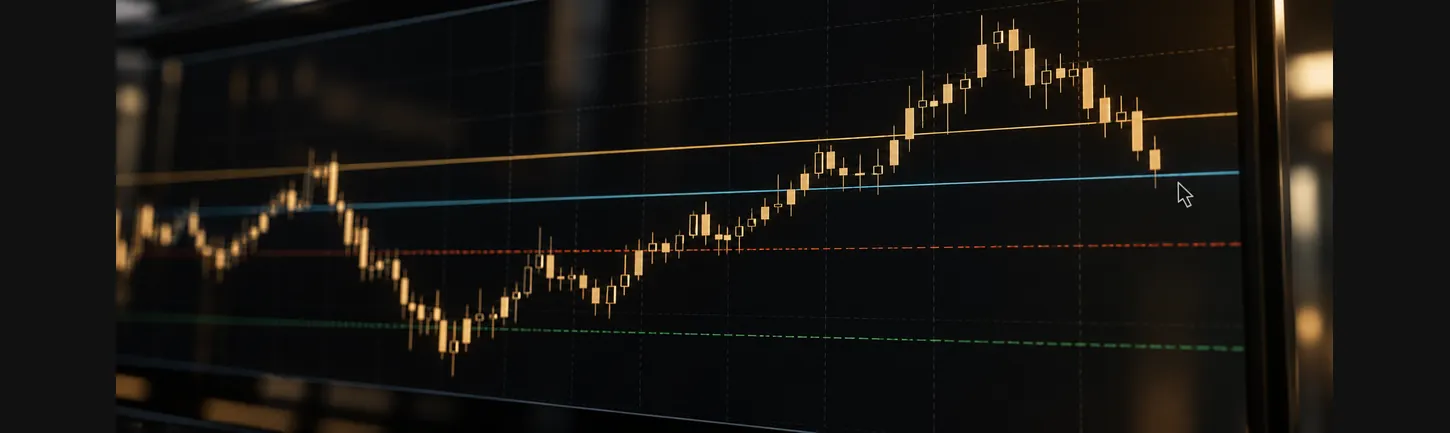
How to Use Multiple Timeframe Analysis in Trading
Trading is often described as a game of probabilities. Markets move for countless reasons, and no single indicator or chart can reveal the complete picture. One of the techniques that separates experienced traders from beginners is Multiple Timeframe Analysis.
Rather than relying on a single chart, traders analyze the market from different perspectives by studying several timeframes simultaneously. This approach helps identify the broader market trend, locate potential entry points, and manage risk more effectively.
Whether you trade forex, commodities, indices, or CFDs, understanding how to use multiple timeframe analysis can significantly improve your decision-making process and help you avoid many common trading mistakes.
What Is Multiple Timeframe Analysis?
Multiple timeframe analysis is the process of examining the same financial instrument across different chart periods before making a trading decision.
For example, a trader may review:
Daily chart to identify the primary trend
4-hour chart to assess medium-term market structure
1-hour chart to find precise trade entries
Instead of making decisions based solely on short-term price movements, traders gain a broader understanding of market conditions.
Think of it as looking at a map. A close-up view may show individual streets, but a wider view reveals the entire city. Both perspectives are useful, and combining them creates a more complete picture.
Why Multiple Timeframe Analysis Matters
Many traders focus only on the chart they trade. Someone using a 15-minute chart may completely ignore what is happening on the daily chart.
This often leads to poor decisions because short-term price movements can be heavily influenced by larger market trends.
Multiple timeframe analysis helps traders:
Identify dominant market trends
Avoid trading against strong momentum
Improve entry timing
Confirm trading signals
Reduce false breakouts
Enhance risk management
By understanding how different timeframes interact, traders can align their positions with broader market direction instead of fighting it.
Understanding Market Structure Across Timeframes
Financial markets are made up of trends within trends.
For example:
A daily chart may show a strong uptrend.
A 4-hour chart may display a temporary pullback.
A 1-hour chart may reveal a new bullish reversal.
Without viewing multiple charts, a trader could mistakenly interpret the short-term pullback as a complete trend reversal.
The ability to recognize these layers of market structure is one of the biggest advantages of using a Multi Timeframe Trading Strategy.
The Three-Timeframe Approach
One of the most widely used methods involves analyzing three different chart periods.
Higher Timeframe: Identify the Trend
The higher timeframe provides the market's overall direction.
Examples include:
Weekly chart
Daily chart
4-hour chart
Questions to ask:
Is the market trending higher or lower?
Are higher highs and higher lows forming?
Is price near major support or resistance levels?
The goal is to establish the dominant trend before considering any trade opportunities.
Intermediate Timeframe: Analyze Market Structure
The intermediate chart helps traders understand the current phase within the larger trend.
Examples include:
Daily chart
4-hour chart
1-hour chart
Here traders look for:
Pullbacks
Consolidations
Trend continuation patterns
Support and resistance zones
This timeframe bridges the gap between long-term trend analysis and trade execution.
Lower Timeframe: Fine-Tune Entries
The lower timeframe is used for execution.
Examples include:
1-hour chart
15-minute chart
5-minute chart
Traders often look for:
Candlestick patterns
Breakouts
Momentum shifts
Entry confirmations
This allows traders to enter positions with greater precision and potentially tighter stop-loss levels.
Choosing the Right Trading Timeframes
There is no universal combination that works for every trader.
Your preferred Trading Timeframes should match your trading style.
Swing Traders
Typical combinations:
Weekly → Daily → 4-Hour
Daily → 4-Hour → 1-Hour
Swing traders typically hold positions for several days or weeks and focus on larger market movements.
Day Traders
Common combinations:
Daily → 1-Hour → 15-Minute
4-Hour → 15-Minute → 5-Minute
Day traders seek opportunities within a single trading session while remaining aware of broader market trends.
Scalpers
Popular combinations:
1-Hour → 15-Minute → 1-Minute
15-Minute → 5-Minute → 1-Minute
Scalpers rely heavily on short-term price movements but still benefit from understanding higher timeframe direction.
A Practical Example
Imagine a trader analyzing gold.
Step 1: Daily Chart
The daily chart shows:
Strong upward trend
Higher highs and higher lows
Price trading above a key moving average
The trader concludes that the primary trend remains bullish.
Step 2: 4-Hour Chart
The 4-hour chart reveals:
Recent pullback toward support
Price approaching a previous breakout level
The pullback appears to be a temporary correction rather than a trend reversal.
Step 3: 1-Hour Chart
The 1-hour chart displays:
Bullish engulfing candle
Increasing buying momentum
Break above short-term resistance
This provides a potential entry signal aligned with the larger trend.
Instead of buying randomly, the trader has confirmation from multiple perspectives.
How Multiple Timeframe Analysis Improves Risk Management
Risk management is one of the most overlooked aspects of trading.
Using multiple timeframes helps traders avoid entering positions during unfavorable market conditions.
For example:
A short-term buy signal may appear attractive.
However, the higher timeframe could show strong bearish momentum.
Without higher timeframe confirmation, the trade may carry unnecessary risk.
By aligning trades with broader trends, traders often increase the probability of success while reducing exposure to unexpected market reversals.
Common Mistakes Traders Make
Using Too Many Timeframes
More information is not always better.
Analyzing six or seven charts often creates confusion rather than clarity.
Most traders can obtain sufficient insight from three carefully selected timeframes.
Ignoring the Higher Timeframe
Many beginners focus exclusively on lower charts.
This can lead to trading against major market trends.
Always start with a larger timeframe before examining entry opportunities.
Forcing Alignment
Markets do not always provide perfect setups.
Some traders attempt to justify trades even when different timeframes send conflicting signals.
Patience is often more valuable than constant market participation.
Switching Between Timeframes Randomly
Consistency is important.
Using different chart combinations every day can make analysis unreliable.
Develop a structured routine and stick with it.
Combining Multiple Timeframe Analysis with Technical Indicators
Multiple timeframe analysis becomes even more effective when combined with Technical Analysis Trading tools.
Popular indicators include:
Moving averages
Relative Strength Index (RSI)
MACD
Bollinger Bands
Fibonacci retracement levels
For example:
Daily chart confirms bullish trend.
4-hour chart shows pullback.
1-hour chart displays RSI recovery from oversold conditions.
This combination provides stronger evidence than relying on a single indicator alone.
Applying Multiple Timeframe Analysis Across Markets
The principles remain consistent regardless of the market being traded.
Forex Markets
In Forex Trading Analysis, traders often use higher timeframes to identify currency strength and lower timeframes for execution.
Commodity Markets
Gold, silver, crude oil, and other commodities frequently experience strong trend movements that can benefit from timeframe alignment.
Stock Indices
Indices such as major global benchmarks often display clearer long-term trends, making multi-timeframe analysis particularly useful.
CFD Trading
CFD traders can apply the same framework across currencies, commodities, indices, and other financial instruments.
Building a Repeatable Trading Routine
Successful traders rely on consistency rather than emotion.
A simple routine may include:
Review the higher timeframe trend.
Identify key support and resistance levels.
Analyze the intermediate timeframe structure.
Wait for confirmation on the lower timeframe.
Define risk before entering the trade.
Execute according to the trading plan.
Following a repeatable process helps eliminate impulsive decisions and promotes disciplined trading behavior.
Final Thoughts
Multiple Timeframe Analysis is one of the most practical and effective techniques available to traders. Instead of relying on a single chart, it provides a layered understanding of market behavior by combining long-term trend identification, medium-term market structure, and short-term entry opportunities.
Whether you are involved in Forex Trading Analysis, commodities, indices, or CFD markets, using a structured Multi Timeframe Trading Strategy can help improve trade quality, strengthen Trend Confirmation Trading, and support more informed decision-making.
Markets will always contain uncertainty, but traders who view price action from multiple perspectives are often better equipped to navigate changing market conditions and identify higher-quality opportunities.