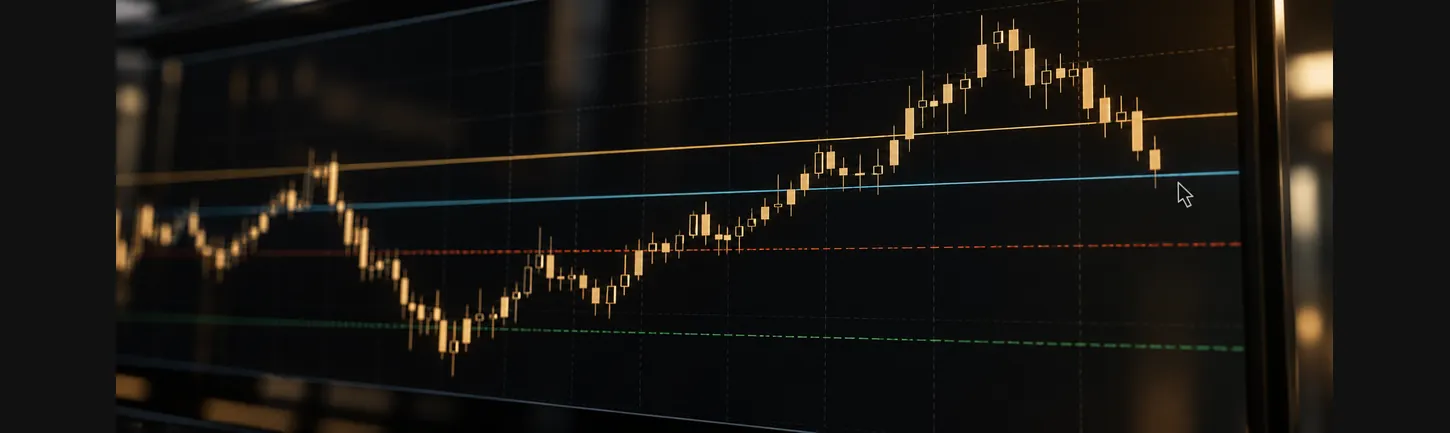
Forex risk management is the set of methods traders use to limit how much of their account is exposed on each trade and across all open positions. The main tools are position sizing, which sets trade size based on the amount at risk; stop-loss orders, which define an exit point if price moves against a position; and percentage limits such as the widely cited 1% rule, under which no more than 1% of account equity is placed at risk on a single trade. These methods do not prevent losses, and stops can fill at worse prices in fast markets, but they make the size of each potential loss more predictable.
Key takeaways
- Position size is usually calculated from three inputs: amount at risk, stop distance in pips and pip value per lot.
- The 1% rule is a common convention that caps the risk on each trade at 1% of account equity; some traders use lower or higher percentages.
- Losses compound: a 20% drawdown needs a 25% gain to recover, and a 50% drawdown needs a 100% gain.
- Correlated positions, leverage, gaps and news events can make actual losses larger than planned.
What Is Forex Risk Management?
Every trade has an uncertain outcome. Risk management does not try to predict which trades will work. It focuses on how much is lost when a trade does not, and how that affects the account over many trades.
In practice, forex risk management usually covers:
- Per-trade risk: how much of the account is exposed on a single position.
- Total exposure: how much is at risk across all open positions at once.
- Leverage and margin: how large positions are relative to equity.
- Event risk: exposure to news, gaps and thin markets.
- Process: records, reviews and rules that keep decisions consistent.
CMS Prime’s article on common trading mistakes beginners make shows how gaps in these areas often lead to large losses.
Position Sizing: The Core Calculation
Position sizing sets the trade size so that the loss at the stop-loss equals a chosen amount. The formula is:
Lot size = Amount at risk ÷ (Stop distance in pips × Pip value per lot)
Example
- Account equity: $10,000
- Risk per trade: 1% = $100
- Pair: EUR/USD, pip value about $10 per standard lot
- Stop distance: 40 pips
Lot size = $100 ÷ (40 × $10) = 0.25 lots
If the stop distance were 20 pips, the same $100 of risk would allow 0.50 lots. If it were 80 pips, the size would drop to 0.125 lots, rounded down to 0.12 lots on platforms that use 0.01-lot steps.
The key point is that the stop distance is set first, based on the chart, and the lot size follows from it. Pip values for different pairs are explained in CMS Prime’s trading need-to-knows, and terms such as pip and lot are defined in its glossary.
The 1% Rule and Other Percentage Limits
The 1% rule is a common guideline in trading education: the risk on any single trade is limited to 1% of account equity. On a $10,000 account, that means a maximum loss of $100 per trade at the stop-loss.
The appeal of a fixed percentage is that it scales with the account. After losses, the amount at risk falls; after gains, it rises. The effect of different percentages over a losing streak is shown below.
|
Risk per trade |
Equity after 5 consecutive losses |
Equity after 10 consecutive losses |
|
0.5% |
$9,752 |
$9,511 |
|
1% |
$9,510 |
$9,044 |
|
2% |
$9,039 |
$8,171 |
|
5% |
$7,738 |
$5,987 |
|
10% |
$5,905 |
$3,487 |
Starting equity is $10,000, and each loss is a fixed percentage of the remaining equity.
Losing streaks happen even with approaches that have worked historically. The percentage chosen shapes how deep the drawdown becomes before conditions change. Some traders use 0.5% or 2% instead of 1%, and some set a separate daily or weekly loss limit after which they stop trading for that period. The 1% figure is a convention, not a regulatory requirement, and it does not determine any outcome.
Why Drawdowns Are Hard to Recover From
Losses and recoveries are not symmetrical. The larger the drawdown, the larger the percentage gain needed to return to the starting level.
|
Drawdown |
Gain needed to recover |
|
10% |
11.1% |
|
20% |
25.0% |
|
30% |
42.9% |
|
50% |
100.0% |
|
75% |
300.0% |
This is the main reason risk management focuses on keeping individual losses small relative to the account.
Stop-Loss Orders: How They Work
A stop-loss is a pending order that closes a position when price reaches a set level. It turns into a market order when triggered, so it can fill at a worse price during gaps or fast markets. This is known as slippage.
Common approaches to stop placement include:
- Structure-based stops. Placed beyond a recent swing high or low, or a support or resistance level, where the original idea would no longer hold.
- Volatility-based stops. Set as a multiple of the Average True Range (ATR), so the distance adjusts to current market conditions. CMS Prime’s guide to market volatility explains why ranges expand and contract.
- Fixed-distance stops. A set number of pips on every trade. Simple, but it ignores differences in volatility between pairs and periods.
- Time-based exits. Closing a position if it has not moved as expected within a set period.
A trailing stop moves with price as a trade moves in its favour, locking in part of an open gain. On MetaTrader, trailing stops run on the local platform and generally stop working if the platform is closed. CMS Prime provides MetaTrader 4 and MetaTrader 5, where stop-loss and target levels can be attached to any order.
Risk-to-Reward Ratio
The risk-to-reward ratio compares the distance to the stop-loss with the distance to the target. A trade with a 40-pip stop and an 80-pip target has a ratio of 1:2.
The ratio needs to be read alongside the win rate, the share of trades that reach their target:
|
Risk-to-reward |
Win rate needed to break even (before costs) |
|
1:1 |
50% |
|
1:1.5 |
40% |
|
1:2 |
33.3% |
|
1:3 |
25% |
A higher ratio needs fewer winning trades to break even, but more distant targets are usually reached less often. Spreads, commissions and swaps raise the break-even win rate further, especially for short-term styles.
Total Exposure and Correlation
Risk per trade is only part of the picture. Several positions that move together can behave like one large position.
For example, buying EUR/USD, GBP/USD and AUD/USD at the same time means selling the US dollar three times. If the dollar strengthens broadly, all three positions can lose together. At 1% risk each, the combined risk is closer to 3%.
The same applies across asset classes. Gold, oil and currencies are often linked through the US dollar and interest rates, as covered in CMS Prime’s article on the gold, oil and forex correlation. A diversified trading portfolio considers how positions interact, not just how many there are.
Leverage and Margin in Risk Management
Leverage sets how much margin a position needs, but it does not change the loss per pip. The actual exposure is better measured by effective leverage: the total value of open positions divided by equity. A $10,000 account with 2 standard lots of EUR/USD open at 1.1000 has effective leverage of 22:1, whatever the maximum leverage the account allows.
Keeping an eye on margin level also matters, because a low margin level can lead to margin calls and automatic stop-outs. CMS Prime lists the maximum leverage for each of its accounts on its account comparison page.
Event Risk: News, Gaps and Weekends
Stop-losses do not protect against every scenario.
- High-impact news can move prices sharply and widen spreads. The CMS Prime economic calendar lists scheduled releases.
- Weekend and holiday gaps can open markets far from the previous close, filling stops at the opening price.
- Thin liquidity around the daily rollover can cause brief spread spikes that trigger nearby stops.
Some traders reduce position size or close positions before major events. Others avoid opening new trades in the minutes around a release.
Keeping Records
Risk rules are easier to follow when results are recorded. A trading journal typically notes entry, stop, target, position size, risk amount, outcome and the reason for the trade. Over time, it shows whether actual losses match planned risk. CMS Prime explains this in why successful traders keep a trading journal.
Frequently Asked Questions
What is the 1% rule in forex? The 1% rule is a common convention under which the risk on any single trade is limited to 1% of account equity. On a $10,000 account, the loss at the stop-loss would be no more than $100. It is a guideline, not a requirement, and some traders use different percentages.
How do I calculate position size in forex? Divide the amount at risk by the stop distance in pips multiplied by the pip value per lot. For example, $100 of risk with a 40-pip stop on EUR/USD, where one lot is worth about $10 per pip, gives a position size of 0.25 lots.
Does a stop-loss lock in the exit price? No. A standard stop-loss becomes a market order when triggered, so it can fill at a worse price during gaps, news or thin liquidity. This difference is called slippage.
What is a good risk-to-reward ratio? There is no single correct ratio. The ratio has to be considered alongside the win rate and trading costs. A 1:2 ratio breaks even at about a 33% win rate before costs, while a 1:1 ratio needs about 50%.
How does leverage affect risk management? Leverage lowers the margin needed to open a position but does not change the loss per pip. It does allow larger positions relative to the account, so effective leverage, total position value divided by equity, gives a clearer picture of exposure.
Why does a 50% loss need a 100% gain to recover? After a 50% loss, the account is half its previous size. Doubling it, a 100% gain, is needed to return to the starting level. This asymmetry grows as drawdowns get larger.
Conclusion
Forex risk management turns uncertain outcomes into defined exposures. Position sizing links the amount at risk to the stop distance and pip value, stop-loss orders set exit points, and percentage limits such as the 1% rule keep individual losses small relative to the account. Drawdown maths, correlation between positions, leverage and event risk all affect how those rules work in practice, and stops can still fill at worse prices in fast markets. CMS Prime’s platforms, economic calendar and educational guides provide the tools to apply and review these methods.
Risk warning: Trading in financial instruments such as Forex, CFDs, and derivatives involves a high level of risk and may not be suitable for all investors. Past performance is not indicative of future results.