

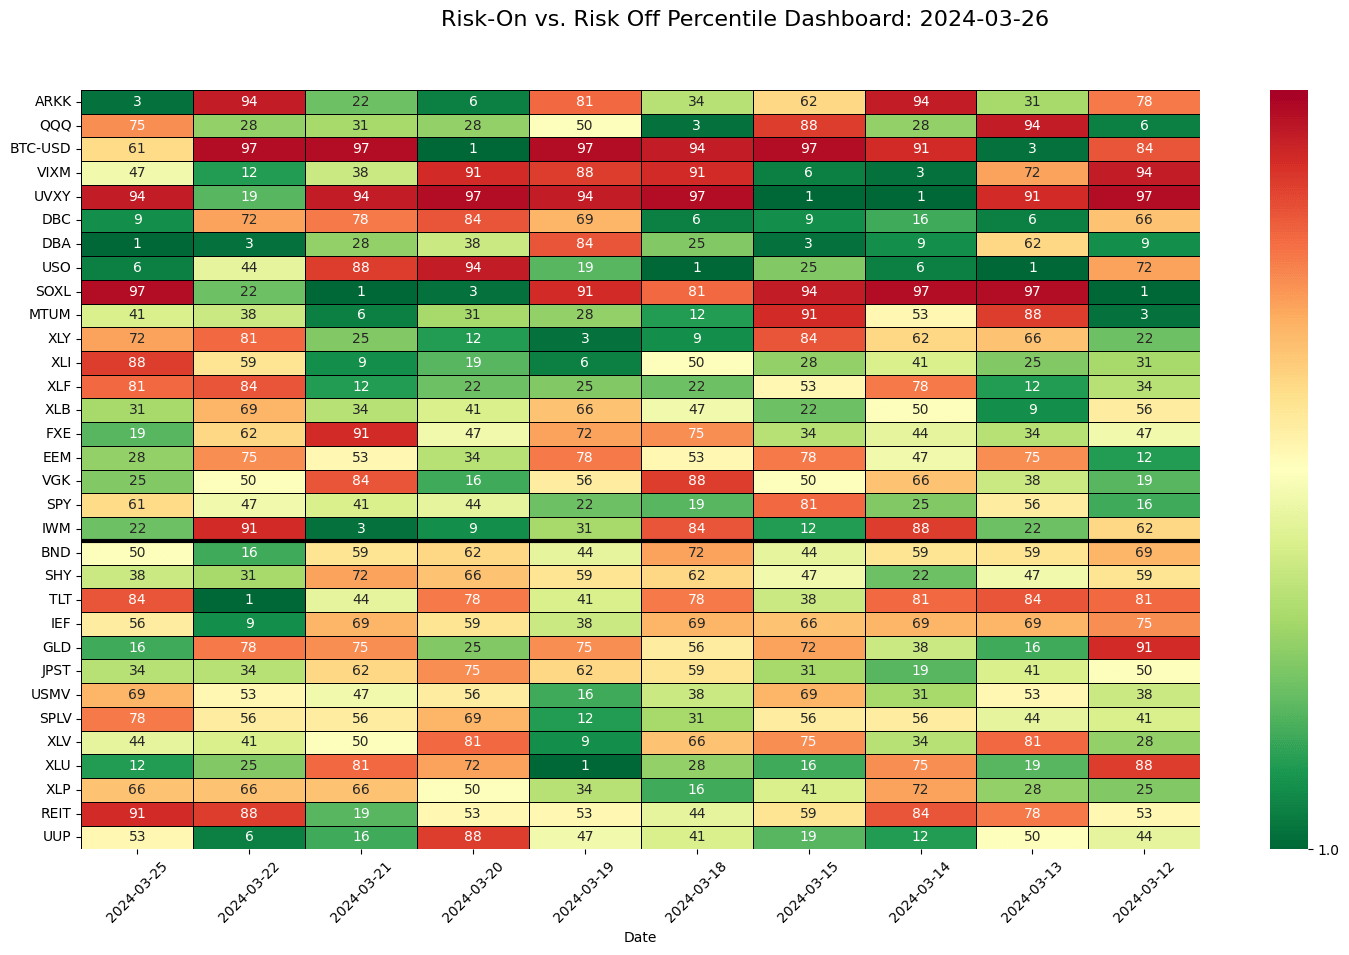
During the period from March 25, 2024, to March 22, 2024, there was a clear change in market sentiment from being more inclined towards risky investments (Risk On) to favoring safer options (Risk Off). Initially, on March 25, assets like ARKK, QQQ and BTC USD were performing well (green zone), while assets like BND, SHY and TLT were not doing as well (red zone). However, by March 22, the situation had reversed, safe assets were doing better with high percentile ranks while riskier assets saw lower percentile ranks. This shift indicates that investors were moving their investments from risky ventures to more secure ones due to a growing aversion to risk in the market.
In contrast, between March 21 and March 18 of the same year, there was a noticeable shift back from favoring safer options (Risk Off) to embracing riskier investments (Risk On). Assets like BND, TLT and GLD that were considered safe on March 21 experienced a decline in their performance by March 18.On the flip side, assets like ARKK, QQQ and SOXL saw an uptick in their rankings during that time frame. This shift suggests that investors felt more confident in the market and were open to taking on more risks.
The sentiment was mixed between March 15, 2024 and March 12, 2024, with no clear trend favoring either Risk On or Risk Off. Some risky assets such as BTC USD and EEM maintained relatively high rankings, while others like ARKK and QQQ had lower rankings. Safe assets also varied in their rankings, with some like TLT and IEF ranking higher than others like USMV and SPLV. This mixed sentiment indicates that investors were being selective in their asset choices amid market uncertainty.
What Does it Tell About the Current Market Scenario:
Investors seem to be playing it safe and selective when it comes to their investment options, showing no clear favoritism towards risky or safe assets. Here are some important points to note about the current market situation and where investors are placing their focus;
Cautious outlook: While certain risk assets like BTC USD and EEM continue to hold strong positions in terms of percentile ranks, others such as ARKK and QQQ lag behind. This indicates that investors are cautiously optimistic about specific sectors or asset types while exercising caution with others.
Seeking safety: Safe assets like TLT and IEF maintain higher percentile ranks, signaling that some investors still prefer the security of government bonds and other low risk investments. This reflects a lingering apprehension about market unpredictability and risks.
Specific sector attention: Investors seem to be concentrating on particular sectors or asset classes rather than making broad decisions. For instance, the technology sector (represented by QQQ) holds a lower percentile rank, whereas the healthcare sector (represented by XLV) enjoys a higher rank. This suggests that investors are assessing each sector individually based on its distinct attributes and potential for growth or stability.
Geopolitical and economic influences: The fluctuating market sentiment could be due to a range of geopolitical and economic factors, like shifts in interest rates, concerns about inflation or global events affecting investor trust.
In summary, the current market outlook as of March 12, 2024 shows a blend of sentiments among investors, who are cautiously optimistic and taking a selective approach to allocating assets. They seem focused on specific sectors and asset types while aiming for a balance between risk and security in their investment portfolios. It’s crucial for investors to stay vigilant about market conditions and adjust their strategies as necessary amidst this uncertain terrain.This illustrates multiple shifts between Risk On and Risk Off sentiments from March 25, 2024 to March 12, 2024. These changes can be attributed to evolving market conditions, economic factors and how investors perceive risk.
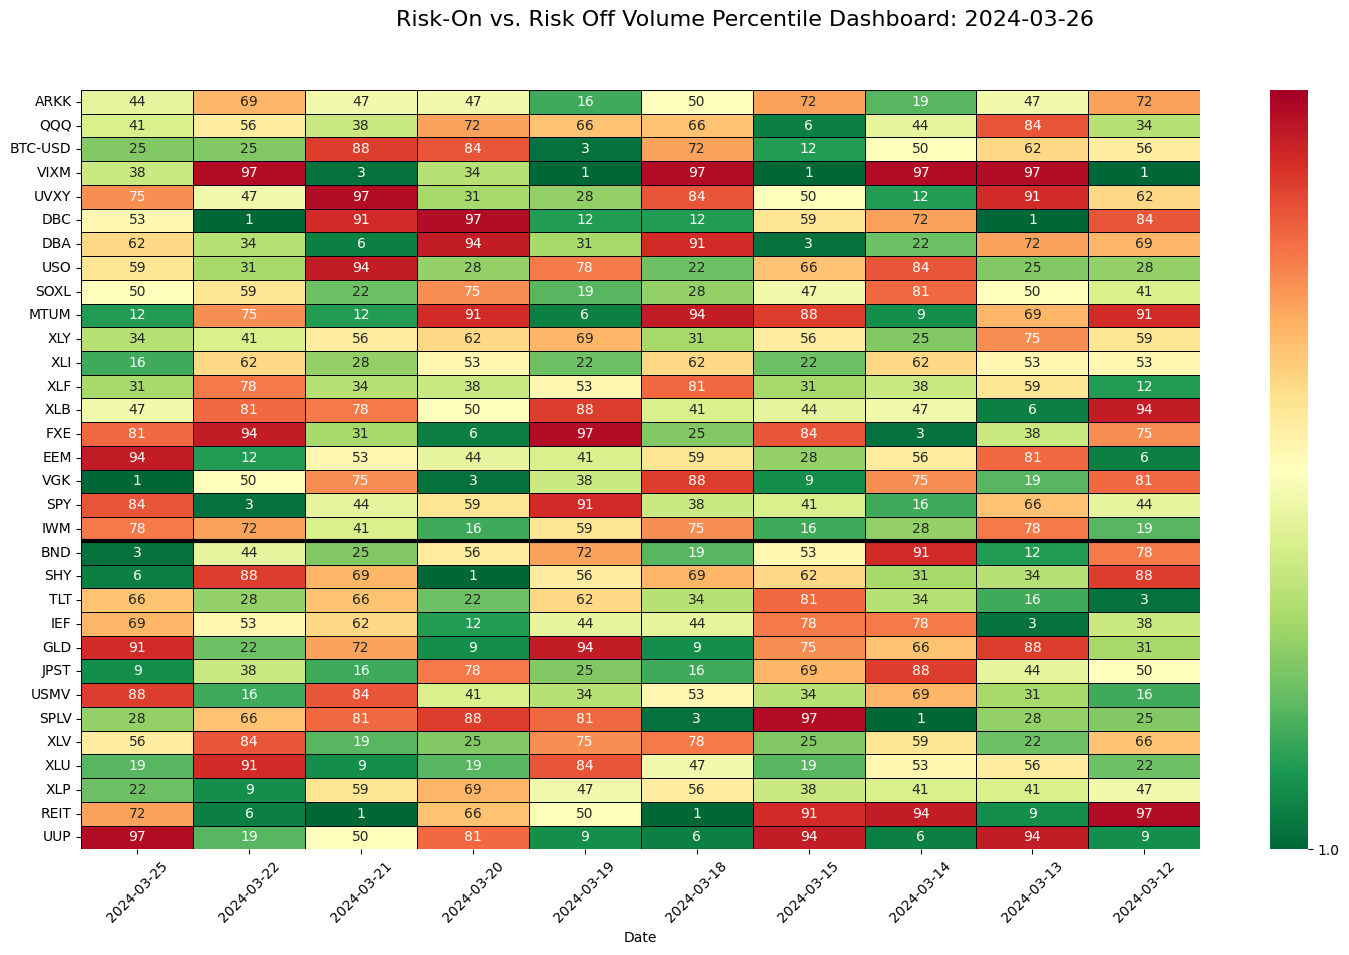
We can see changes in the trading volume of different assets, giving us insights into how investors feel and their risk preferences.
Transition from Risk On to Risk Off (March 25, 2024, to March 22, 2024): During this timeframe, there was a noticeable switch in trading volume from risky assets to safe assets. On March 25, 2024, high volume percentiles were seen for risk assets like ARKK, QQQ and BTC USD while safe assets like BND, SHY and TLT had lower ranks. However, by March 22, 2024, the volume percentiles for safe assets increased significantly while those for risky assets decreased. This shift suggests that investors were moving their investments from riskier options to safer ones as a sign of increasing aversion to risks in the market.
Transition from Risk Off to Risk On (March 21, 2024, to March 18, 2024): Between March 21 and March 18 of the same year saw a change in trading volume where money moved from safe assets back to risky ones. Safe options like BND, TLT and GLD had high volume ranks on March 21 but by March18 experienced a decline in their rankings.On the flip side, assets like ARKK, QQQ and SOXL saw an uptick in their volume percentile rankings during that time frame. This hints at investors feeling more confident in the market and being open to taking risks.
Sentiment Mix (15th March 2024 to 12th March 2024): The period between 15th March 2024 and 12th March 2024 reflects a blend of sentiments regarding trading volumes. Some risky assets such as BTC USD and EEM maintained relatively high volume percentile rankings, while others like ARKK and QQQ had lower ranks. Likewise, safe assets displayed varied volume percentile rankings with certain ones (e.g., TLT, IEF) ranking higher and others (e.g., USMV, SPLV) ranking lower. This mixed sentiment implies that investors were discerning in their asset selections and that the market was facing uncertainty.
As of 12th March 2024, the volume percentile rankings slightly favored risk assets, with ARKK, QQQ and BTC USD holding higher ranks compared to most safe assets. Nevertheless, the overall sentiment seems mixed as some safe assets like GLD and TLT continue to maintain relatively high volume percentile ranks.
In summary, the Risk On versus Risk Off Volume Percentile Method highlights different shifts in how investors feel about risk and preference from March 25, 2024, to March 12, 2024. These changes in trading activity across various assets offer valuable insights into market trends and can assist investors in making well informed choices based on current market conditions. As of March 12, 2024, the market appears to have a mix of sentiments, leaning slightly towards riskier assets. However, it’s advisable for investors to stay vigilant and keep a close eye on the market for any new developments.