Utilizing Bollinger Bands and Moving Averages:
Buy Signal: Keep an eye out for the price positioning itself above a long term Moving Average (like the 20 SMA) to indicate a general uptrend. At the same time, look for instances where the price touches or breaks below the lower Bollinger Band, suggesting potential oversold conditions and a potential upward price movement.
Sell Signal: Note when the price falls below the long term Moving Average, signaling a downtrend. Watch for occasions when the price reaches or surpasses the upper Bollinger Band, indicating possible overbought conditions and an anticipated reversal or pullback.
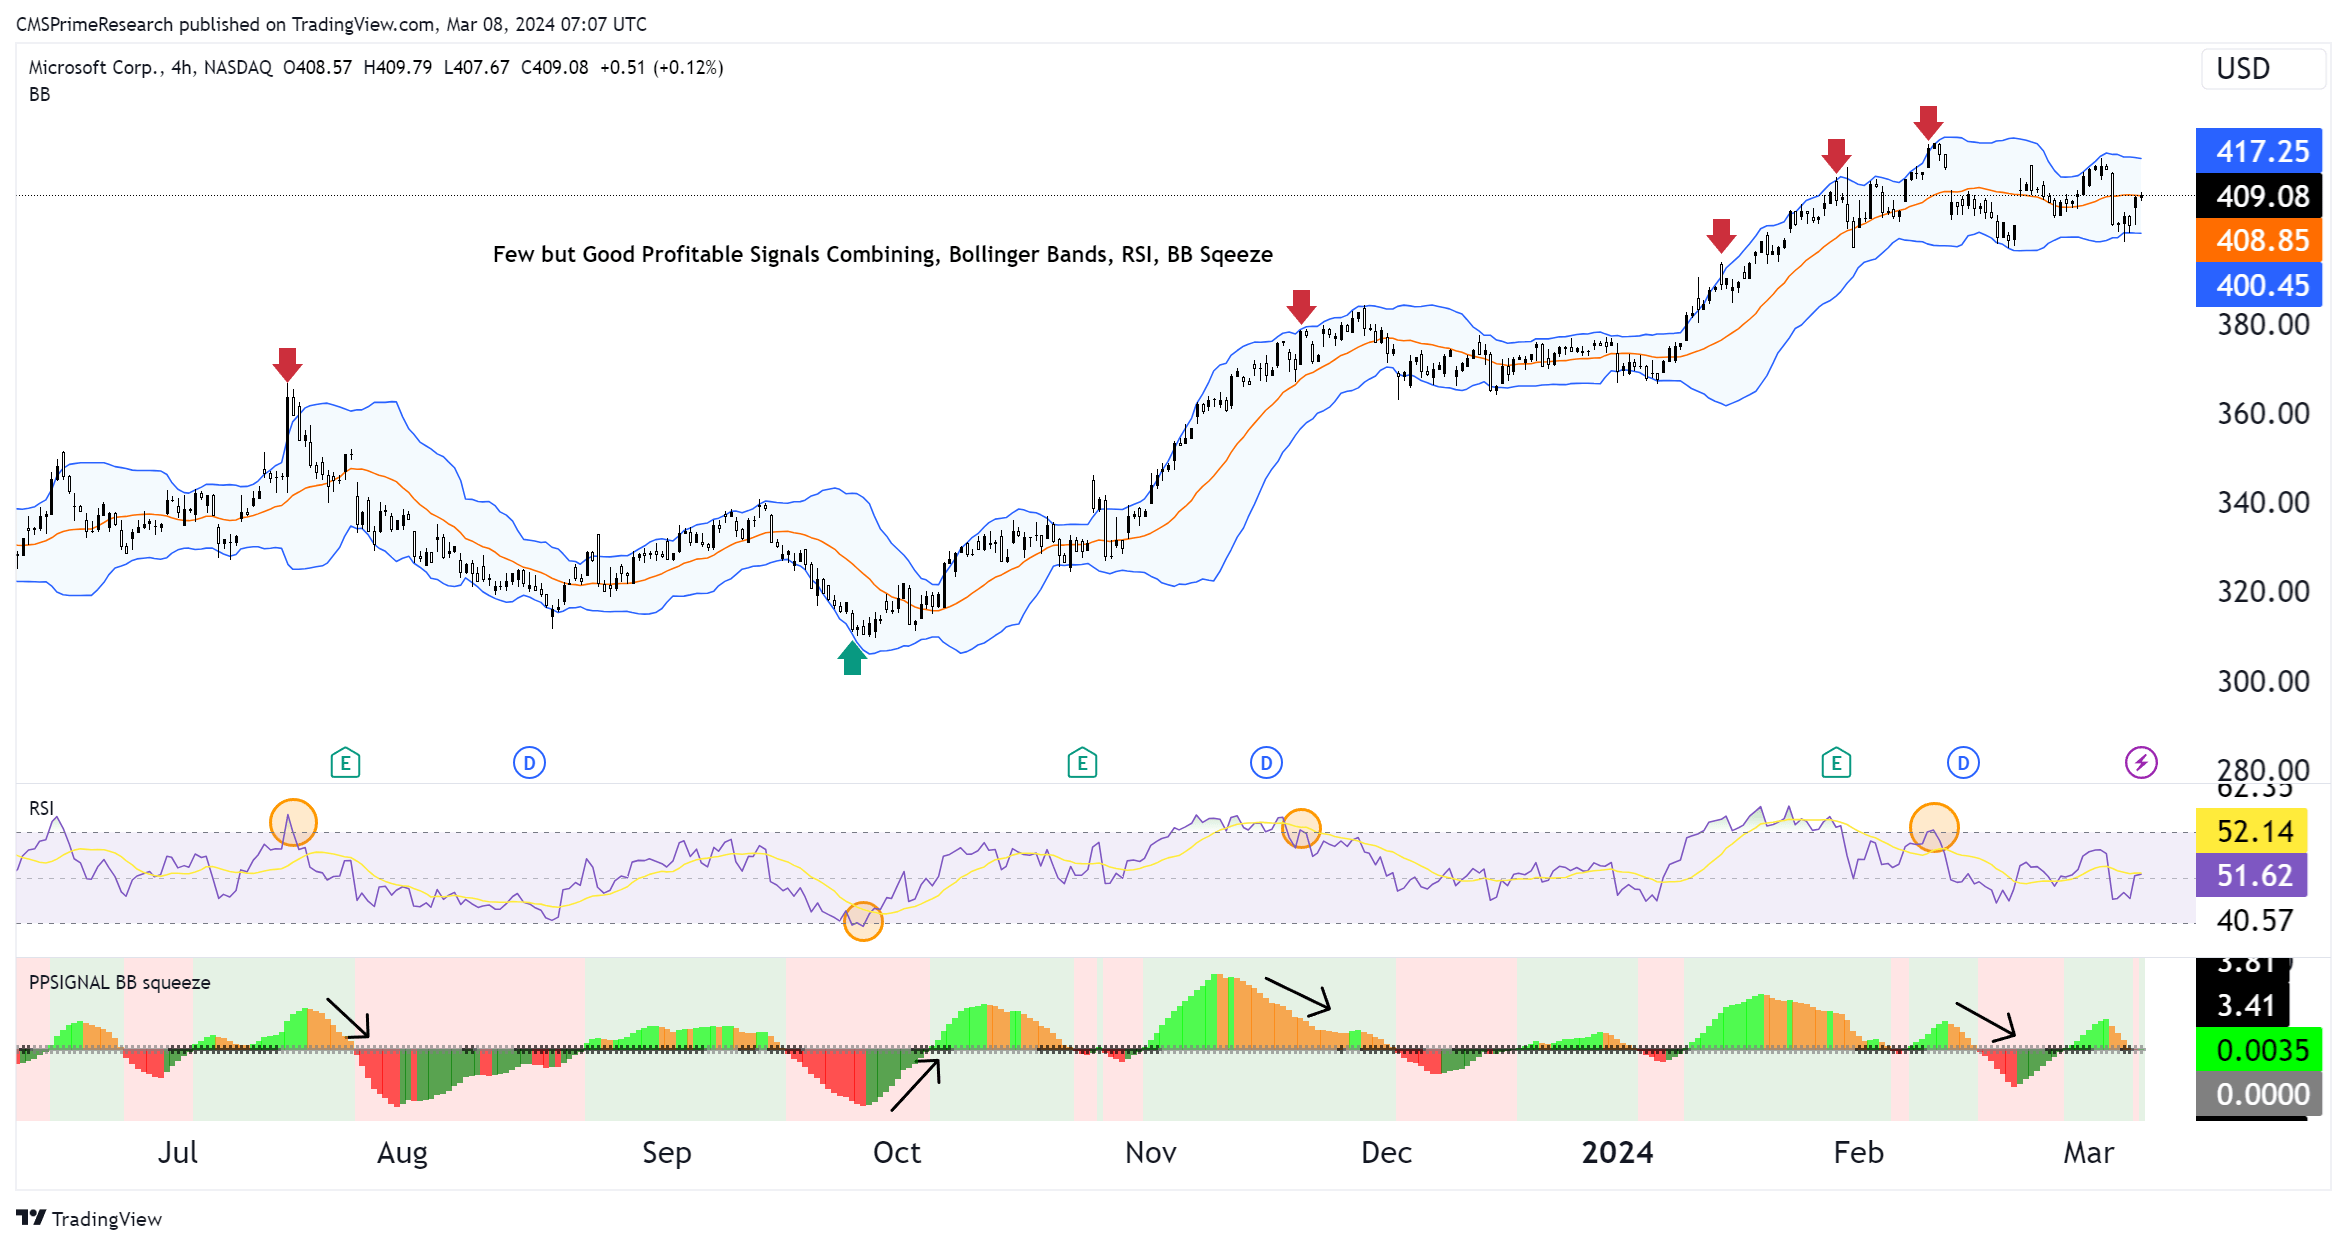
Bollinger Band Squeeze Approach: This method centers on observing when the Bollinger Bands begin to narrow, indicating decreased volatility that often precedes a significant price shift. A squeeze occurs when the bands move closer together.
Entry Signal: Following a squeeze, breaking out above the upper Bollinger Band can signify a potential buy signal, while breaching below the lower band may indicate a sell signal. It’s essential to wait for a clear breakout to avoid false signals.
Enhanced Confirmation with RSI Integration;
For improved accuracy in entry and exit points and minimizing false indications, incorporate the Relative Strength Index (RSI).
An RSI reading above 70 indicates that the market may be overbought, potentially signaling a sell opportunity when combined with a Bollinger Band breakout. Conversely, an RSI below 30 suggests oversold conditions, which could align with a buying opportunity during a Bollinger Band breakout.
Risk Management:
It is important to manage risk by strategically placing stop loss orders below or above your entry point (depending on whether you are going long or short) to limit potential losses. Additionally, consider using trailing stops to safeguard profits as a trade moves in your favor.
Backtesting and Adjustment:
Before applying this strategy in live trading, backtest it using historical data to evaluate its effectiveness and make any necessary tweaks.
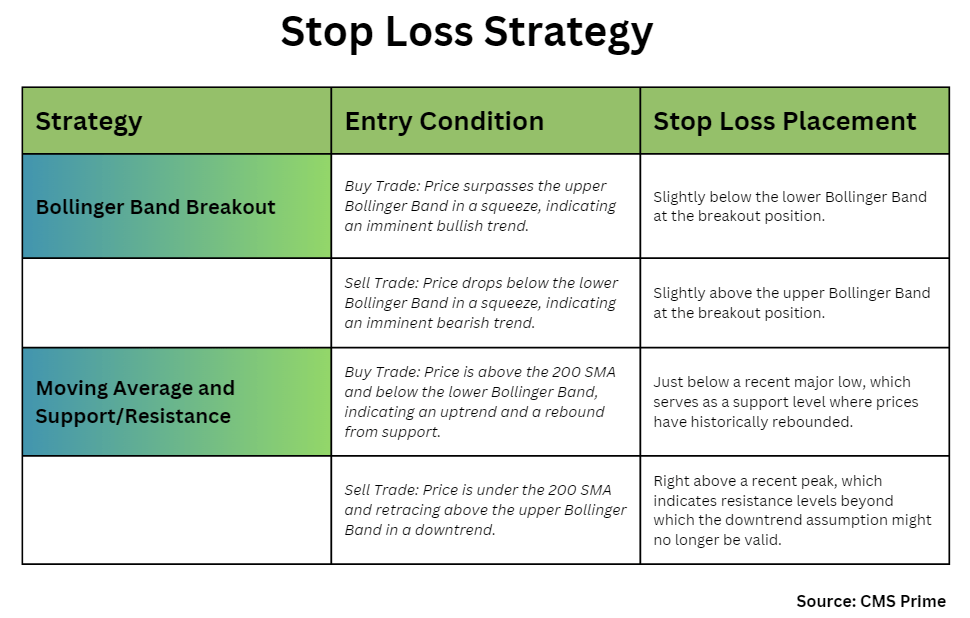
Strategy 1: Stop Loss Using Volatility Indicators (Bollinger Bands)
When initiating a trade based on a Bollinger Band breakout, like purchasing when the price surpasses the upper Bollinger Band in a squeeze, indicating an imminent bullish trend, set the stop loss slightly below the lower Bollinger Band at the breakout position. This is because the lower band serves as a volatility threshold, below which the initial breakout assumption loses validity.
Validation Approach:
Buy Trade; If entering a buy trade during an upward Bollinger Band squeeze breakout, position the stop loss just under the lower band at the breakout point. This considers market volatility and shields against false breakouts.
Sell Trade: Conversely, if engaging in a sell trade upon price dropping below the lower Bollinger Band, position the stop loss just above the upper band at the breakout point to ensure there’s a buffer against volatility.
Strategy 2: Stop Loss Based on Market Movements (Moving Averages and Support/Resistance)
When entering a trade using the Moving Average and price action strategy, such as when a buy signal is triggered by the price being higher than the 200 SMA with bullish price movements, it’s advisable to position the stop loss slightly below a recent significant low for buying or above a recent significant high for selling. This approach utilizes the Moving Average and support/resistance levels to clearly identify exit points.
Validation Logic:
For Buying: If you’re buying because the price is above the 200 SMA and below the lower Bollinger band, indicating an uptrend and a rebound from support, set your stop loss just below a recent major low. This low serves as a support level where prices have historically rebounded.
For Selling: In case of initiating a sell trade due to the price being under the 200 SMA and retracing above the upper Bollinger band in a downtrend, place your stop loss right above a recent peak. This peak indicates resistance levels beyond which the downtrend assumption might no longer be valid.