Current Factors Influencing Current Gold Prices:
- Gold prices stabilized on Thursday as investors processed remarks from Federal Reserve Governor Christopher Waller regarding potential interest rate cuts and awaited further U.S. economic data for policy insights.
- Spot gold rose by 0.1% to $2,195 per ounce, while U.S. gold futures increased by 0.18% to $2,194.
- The Fed signalled they want to be cutting rates and there’s a geopolitical risk concern that continues to linger in the markets around these wars, both in Ukraine and in the Middle East, which is gold supportive
- Gold prices are rangebound for most of the time this month and a break above current resistance level around $2,225 per ounce could see prices heading towards the $2,300 mark
- Last week, gold reached a record high following the Federal Reserve’s anticipation of three rate cuts in 2024 despite recent high inflation readings.
- Fed Governor Waller remarked on Wednesday that recent disappointing inflation data supports the case for the U.S. central bank to refrain from cutting its short-term interest rate target.
- Investors are now anticipating the U.S. core personal consumption expenditure (PCE) price index report scheduled for Friday to assess when the Fed might commence cutting interest rates.
- The PCE price index is expected to rise by 0.3% in February, maintaining the annual pace at 2.8%. Investors will also focus on the weekly U.S. initial jobless claims report due later in the day.
- According to the CME Group’s FedWatch Tool, traders are currently pricing in a 62% probability that the Fed will initiate rate cuts in June.
Fundamental and Technical Analysis
Technical Outlook:
Technical Perspective:
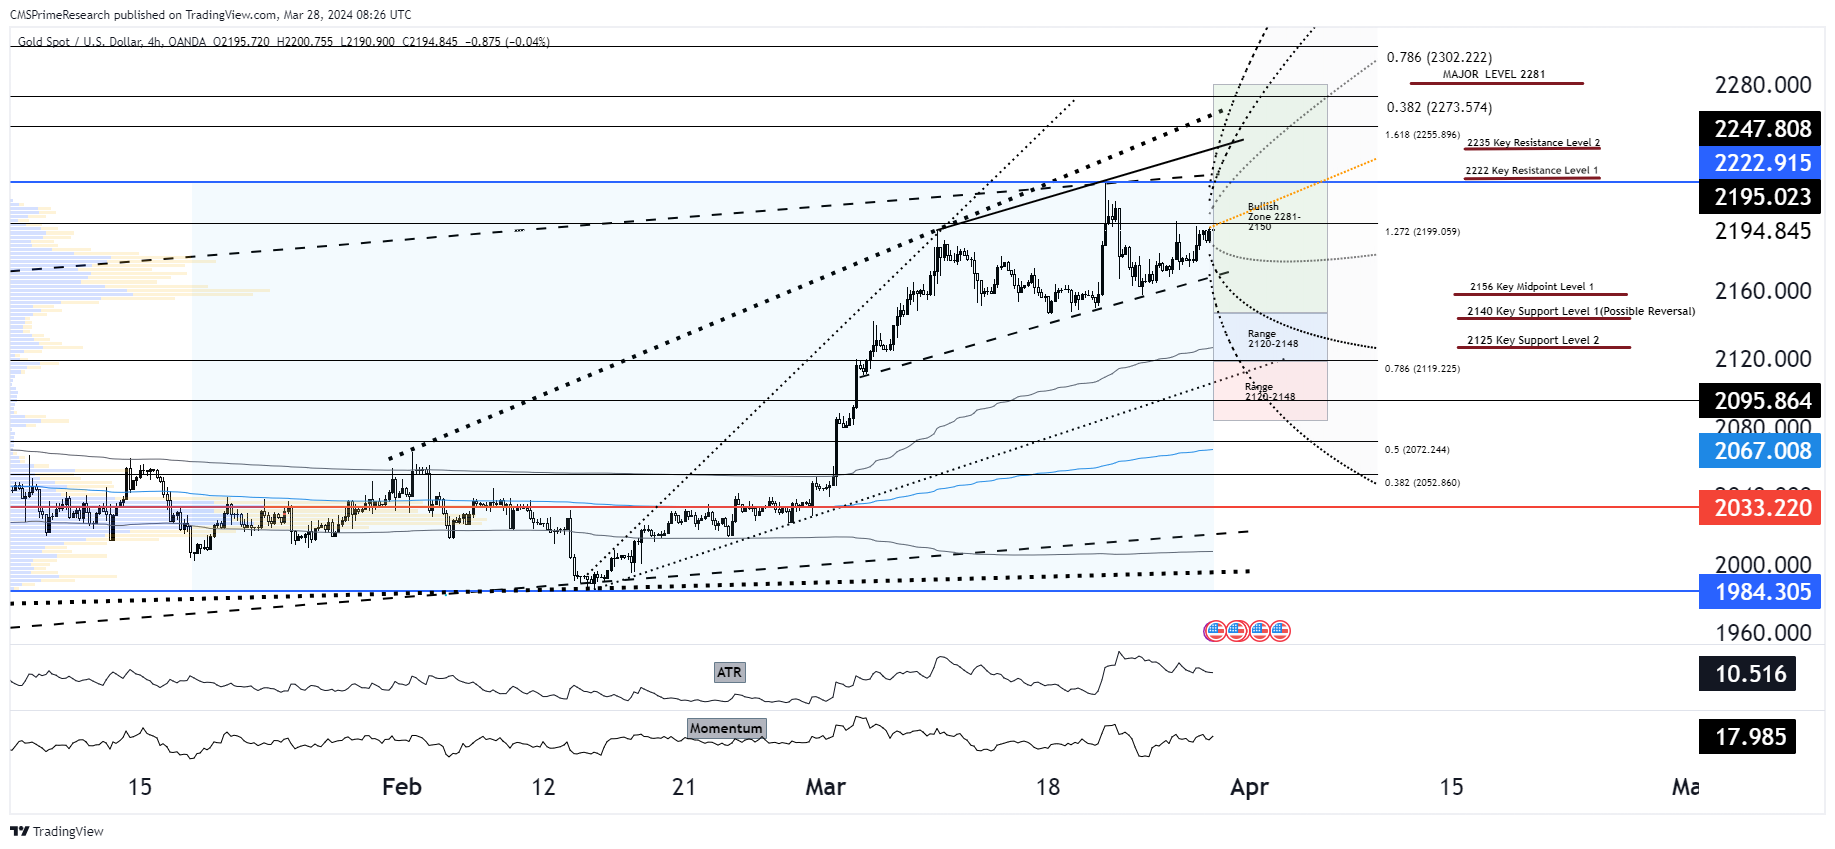
Gold chart demonstrates a market that is bullish, with prices exhibiting signs of consolidation:
Resistance Zones:
- Gold is currently facing resistance at the $2225 level. The recent peak serves as a near-term resistance point, with a potential stretch to the 1.272 Fibonacci extension level at approximately $2236.
Support Structures:
- On the downside, initial support is found at $2125. Additional support is observed at the $2100 psychological level, reinforced by the Fibonacci retracement level at 0.786 ($2119.225).
Indicator Analysis:
- The ATR indicates reduced volatility compared to previous weeks, suggesting that the immediate strong uptrend is losing momentum and entering consolidation.
- The Momentum indicator has started to plateau, confirming the consolidation phase and hinting at possible exhaustion in buying pressure.
Fundamental Context:
Gold’s pricing is currently influenced by several fundamental factors:
Fed Interest Rate Expectations:
- Remarks from Fed Governor Christopher Waller suggesting potential rate cuts have fed into the bullish sentiment for gold.
Geopolitical Concerns:
- Ongoing conflicts provide underlying support for gold as a safe-haven asset.
Economic Data Anticipation:
- Upcoming U.S. core PCE price index and jobless claims reports are highly anticipated for indications of when the Fed might begin rate reductions.
Scenario Projections:
Bullish Breakout (40% Probability):
- A break above the current resistance level could propel gold toward the $2300 mark if upcoming economic data reinforces rate cut expectations.
- Price Target: $2225 to $2300
- Sentiment Analysis: A breakout would amplify positive sentiment, supported by dovish Fed actions and persistent geopolitical risks.
Bearish Retracement (30% Probability):
- Disappointing economic data or shifts in the geopolitical landscape could trigger a retracement to key support levels, with a focus on $2125 as the first line of defense.
- Price Target: Retest $2125 to $2100
- Sentiment Analysis: Negative sentiment could increase if the bullish factors wane, leading to profit-taking and a reevaluation of the bullish thesis.
Continued Consolidation (30% Probability):
- In the absence of new catalysts, gold may remain range-bound, with traders seeking direction between $2125 and $2225.
- Price Target: Consolidation within the $2125 to $2225 range
- Sentiment Analysis: Neutral sentiment could persist as market participants weigh the likelihood of rate cuts against resilient inflation.
Overall Market Sentiment Synthesis:
- Positive Sentiment: Maintained at 40%, bolstered by dovish Fed signals and geopolitical risk factors.
- Negative Sentiment: A measured 30%, accounting for the potential of an economic data-driven pullback.
- Neutral Sentiment: Equal at 30%, signifying a wait-and-see approach among investors.
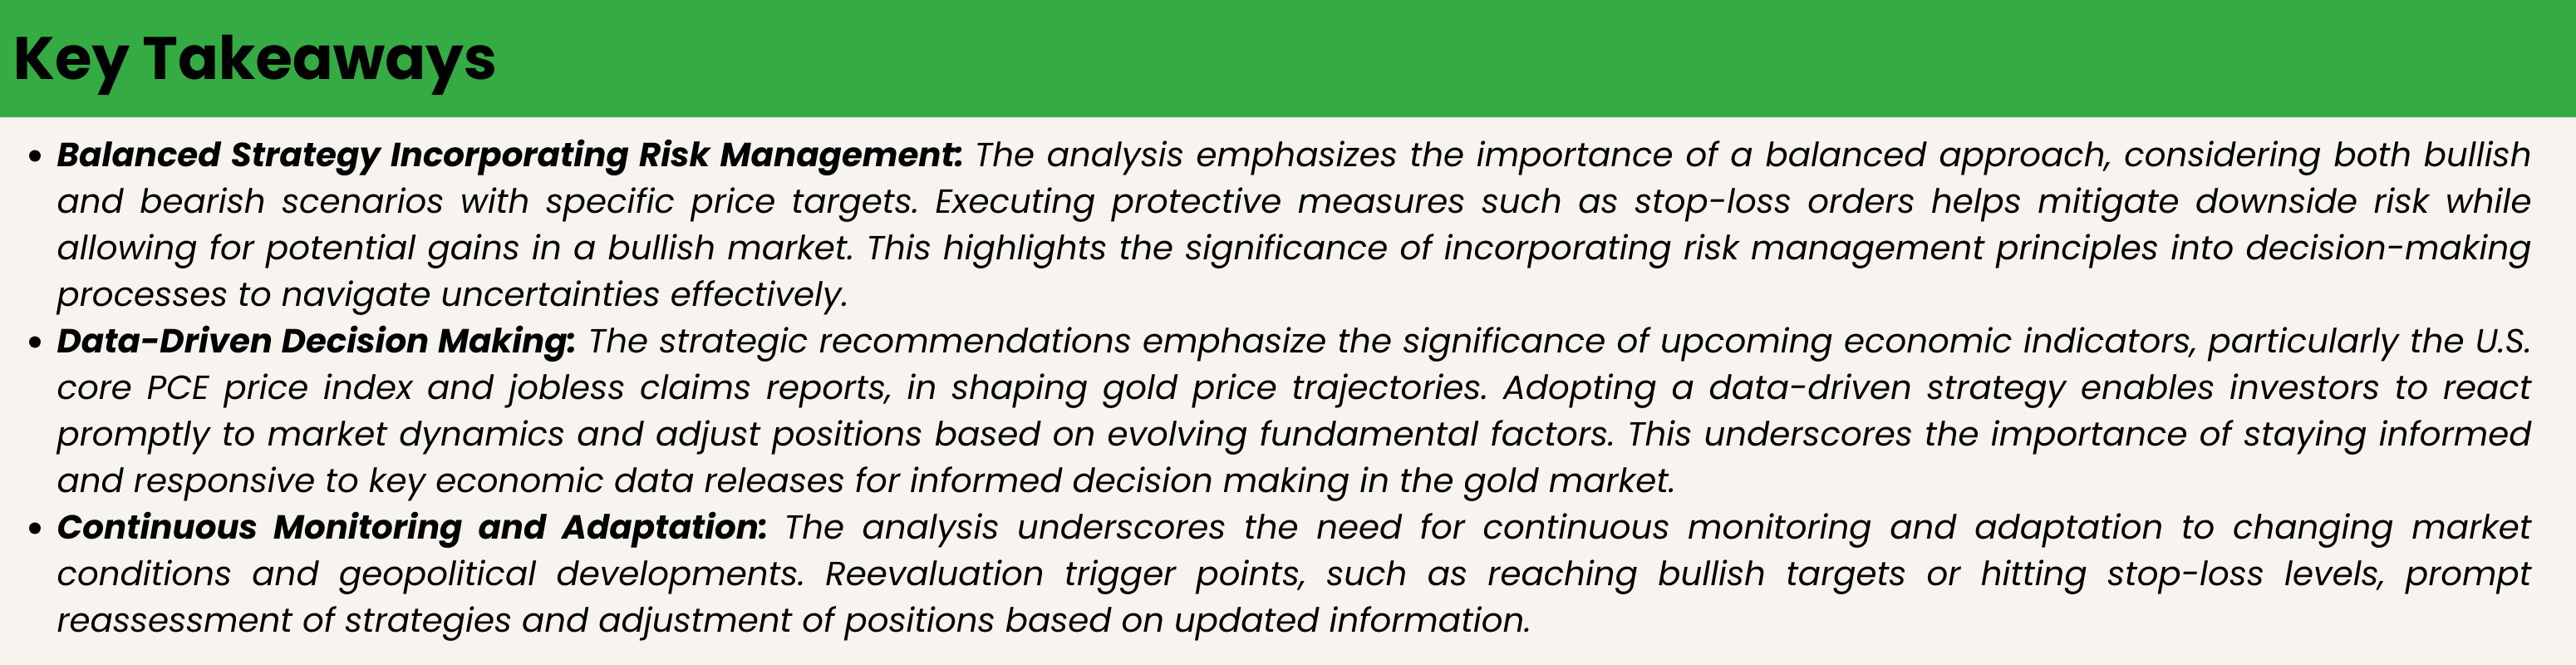
Strategic Guidance:
- Risk Management: Protective stop-loss orders should be placed to safeguard positions against potential pullbacks.
- Data-Driven Strategy: Focus on the upcoming PCE report and jobless claims for rate cut cues that could significantly impact gold’s price trajectory.
- Diversification: Consider balancing gold holdings with yield-oriented investments to mitigate exposure to a single asset class.
- Market Monitoring: Stay vigilant for signs of a sentiment shift following the Fed’s next policy meeting and subsequent economic data releases.
In conclusion, while the current setup leans bullish due to dovish Fed expectations and safe-haven demand, should remain cautious and prepare for multiple scenarios, employing a sophisticated approach that leverages technical signals and fundamental events to navigate the gold market effectively.
Target Levels and Analysis--- 2140-2125 or 2222-2235
Scenarios and Price Targets:
- Bullish Targets: Between $2225 and $2236 and Stretch Target of 2244, with a bullish breakout probability of 40%.
- Bearish Targets: Between $2140 and $2125, with a bearish retracement probability of 30%.
- Neutral Scenario: Continued consolidation with a probability of 30%, suggesting a range-bound market between $2125 and $2225.
Strategy Development:
Calculate Expected Price Movements:
- Bullish Expectation: The midpoint of the bullish range is $2230.5 (($2225 + $2236) / 2). From the current price of $2194, the expected bullish movement is +$36.5.
- Bearish Expectation: The midpoint of the bearish range is $2120 (($2140 + $2100) / 2). From the current price of $2194, the expected bearish movement is -$54.
Assign Probabilities to Each Scenario:
- Bullish Movement Expected Value: $36.5 * 40% = $14.6
- Bearish Movement Expected Value: -$54 * 30% = -$16.2
- Neutral Scenario: Given as 30%, but we focus on specific price action within the bullish and bearish scenarios for this analysis.
Strategic Recommendations Based on Expected Values:
- Risk-Reward Assessment: The expected value calculation suggests a bullish tilt but acknowledges significant downside risk. The positive expected value of the bullish scenario ($14.6) compared to the bearish (-$16.2) underscores a net positive expectancy but with caution due to the magnitude of potential loss.
- Positioning: Given the current price of $2194 and the analysis, a cautiously optimistic positioning towards the bullish scenario seems mathematically reasonable, with preparedness for a bearish pullback.
Implement Protective Measures:
- Stop-Loss Orders: Placing a stop-loss order just below the midpoint level at ($2172) can limit downside risk.
- Take-Profit Orders: Setting take-profit orders within the bullish target range ($2225 to $2236) to capture expected gains.
Reevaluation Trigger Points:
- Upon Reaching Bullish Targets: Reassess market conditions, especially after hitting the $2225 level, for potential further upside or reversal signs.
- Upon Hitting Stop-Loss: Reevaluate the bearish potential and market sentiment, possibly adjusting to a more defensive strategy based on updated economic indicators and geopolitical developments.
Continuous Monitoring and Adjustment:
- Economic Indicators: The upcoming U.S. core PCE price index and jobless claims reports are critical. A stronger-than-expected report could amplify the bullish scenario’s probability, while a weaker report might increase the likelihood of the bearish scenario.
- Geopolitical Developments: Stay abreast of any changes in geopolitical tensions that could impact gold prices.
To know more about CMS Prime visit us at https://cmsprime.com
Disclaimer: This is not an Investment Advice. Investing and trading in currencies involve inherent risks. It’s essential to conduct thorough research and consider your risk tolerance before engaging in any financial activities.