Current Factors Influencing Current Gold Prices:
- Gold prices experienced a decline on Thursday as investors opted to secure profits following a sustained period of gains and pressure from institutional investors aiming to generate cash, with attention shifting towards U.S. economic data for insights into the Federal Reserve’s interest rate trajectory.
- Spot gold is up by .22% to $2,320 per ounce, marking a slight pullback from the recent 3 day lows.
- There has been noticeable pressure on certain investors, particularly on the institutional front, to raise funds, leading them to sell off some of their commodity holdings. This selling pressure was attributed to profit-taking following a prolonged uptrend in gold prices, coupled with reduced tensions in the Middle East, resulting in an overall retreat in prices.
- Gold prices have witnessed a decline of over $100 since reaching a record peak of $2,431 level on April 12, with the current week witnessing a drop of more than 2.8% so far.
- The Federal Reserve’s rate-setting committee is scheduled to meet on April 30-May 1. Ahead of this, investors are awaiting the release of U.S. first-quarter GDP data on Thursday and the March core Personal Consumption Expenditures Price Index (PCE) data on Friday.
- Although geopolitical concerns have somewhat subsided, the trajectory of the dollar and gold prices could be influenced by the outcome of the data releases, particularly if the core PCE number aligns with or falls below expectations. However, if inflation indicators surpass expectations, gold prices could face additional downward pressure, as per Meir’s assessment.
- Spot gold may potentially revisit support levels at $2,290 per ounce, having failed to breach resistance at $2,330
- In the broader spectrum of precious metals, spot silver fell by 0.27% to $27.06 per ounce, spot platinum edged down 0.01% to $901.55, and palladium lost 0.90% to $990.90.
Fundamental and Technical Analysis
Technical Breakdown:
Price Action Analysis:
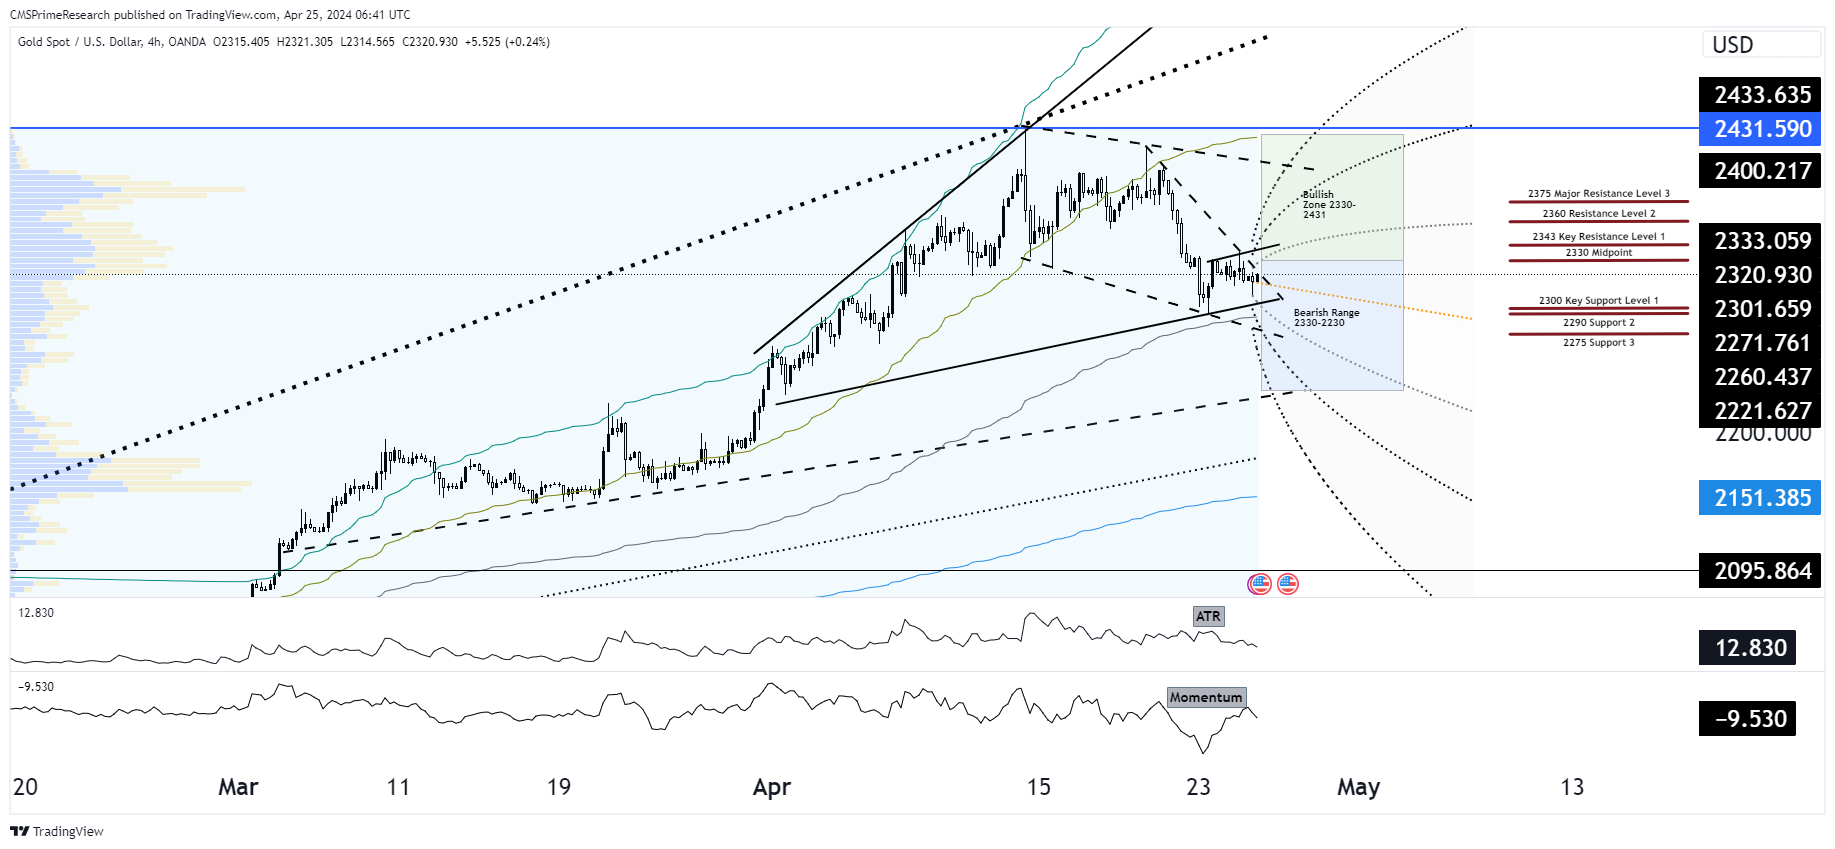
- The chart indicates gold has recently broken below an uptrend channel, signifying potential bearish momentum or at least a corrective phase from the previous highs.
Support Zones:
- The key support level at $2330 has been breached, and the price is hovering above the next support level at $2290.
Resistance Thresholds:
- After failing to hold the $2330 level, this price point may now act as resistance. The primary resistance is the previous high near $2431.
Technical Indicators:
- ATR reflects heightened volatility, suggesting significant price swings.
- Momentum has turned negative, aligning with the recent price drop.
Fundamental Forces:
Profit-taking Behavior:
- Institutional investors cashing in on gains have contributed to the recent pullback.
Economic Data Anticipation:
- Investors are keenly awaiting U.S. GDP and PCE data for signs of economic strength, which could impact the Fed’s interest rate decisions.
Sentiment Scenarios and Price Forecasts:
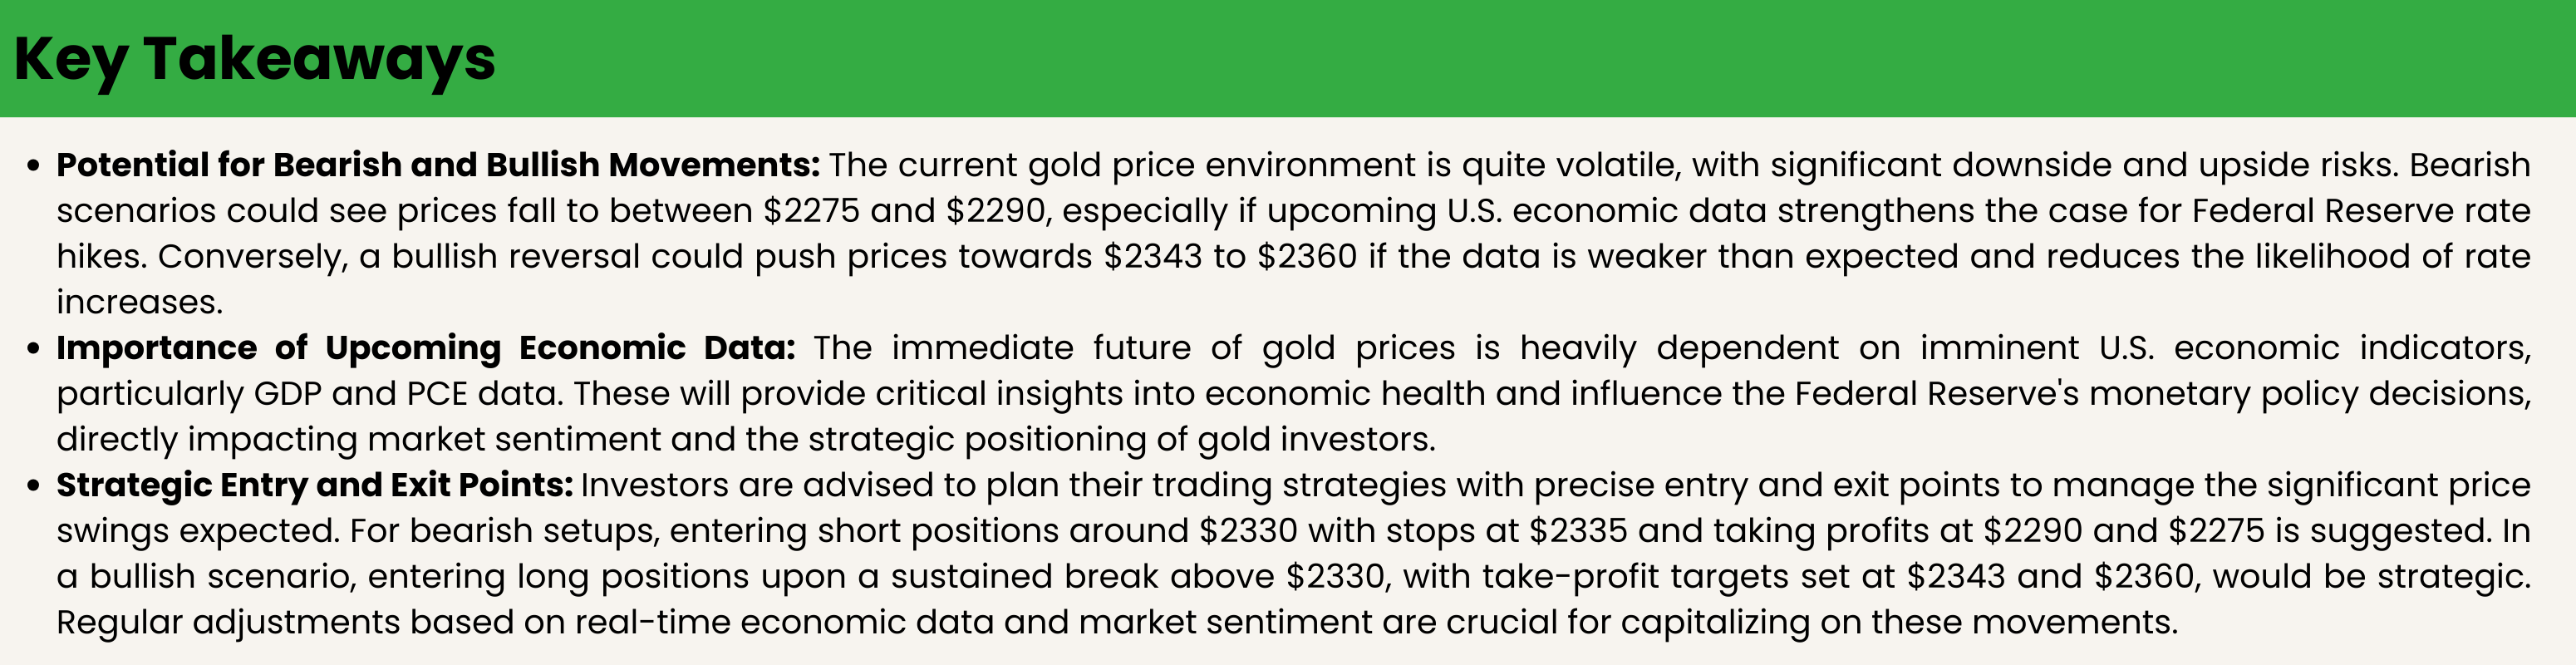
Bearish Continuation (40% Probability):
- If U.S. economic data suggests a stronger economy, expectations for Fed rate hikes could pressure gold prices.
- Price Targets: Could drop to $2290 and, if broken, head towards $2275 or lower.
- Sentiment Analysis: Expectations of hawkish Fed moves may dampen the allure of gold, leading to increased bearish sentiment.
Bullish Reversal (30% Probability):
- A dovish Fed stance or weak economic data may renew interest in gold as a hedge, pushing prices back up.
- Price Targets: Possible retest of $2330, with potential to scale back towards 2343 and 2360 recent highs if the momentum is strong.
- Sentiment Analysis: The soft dollar or geopolitical risks could rekindle the bullish sentiment for gold.
Consolidation Phase (30% Probability):
- Absent significant catalysts, gold could stabilize and consolidate within the current range.
- Price Targets: Trading between $2290 and $2330.
- Sentiment Analysis: A wait-and-see approach could dominate the market sentiment as traders interpret unfolding economic data.
Target Levels and Analysis--- 2343-2360 or 2290-2275
Given the current market conditions for gold, where the price stands at $2320 and the ATR is 13.2 indicating significant volatility, we can outline a strategy to navigate both potential upside and downside scenarios. This approach will utilize the defined bullish price targets of $2343 to $2360 and bearish targets of $2290 to $2275.
Strategy Components
1. Bearish Scenario Planning
- Entry Point: Given the recent breach of the $2330 support level and a negative momentum shift, consider initiating a short position if the price fails to regain this level and shows signs of continued weakness. A good entry could be if the price approaches but fails to surpass the $2330, now acting as resistance.
- Stop-Loss: Set the stop-loss just above the new resistance level at $2335 to protect against a sudden reversal of the bearish trend.
- Take-Profit Targets: The first take-profit target can be set at $2290, which aligns with the first bearish target. If the downward momentum continues, a further take-profit can be aimed at $2275, which represents a deeper bearish potential.
2. Bullish Reversal Strategy
- Entry Point: If the price shows signs of a strong rebound, particularly if it breaks and sustains above the $2330 resistance level, consider going long. This would indicate potential reversal or correction from the bearish trend.
- Stop-Loss: Place a stop-loss at around $2310, below the recent lows, to limit losses if the bullish reversal doesn’t materialize.
- Take-Profit Targets: Set the initial take-profit at $2343 and a second target at $2360, aligning with the upper range of the bullish scenario.
3. Monitoring and Adjustments
- Economic Indicators: Keep a close watch on upcoming U.S. economic releases, especially GDP and PCE data, as these will have significant implications on Fed policy expectations and thus on gold prices.
- Technical Adjustments: Regularly reassess the position of the price relative to moving averages, Fibonacci levels, and channel patterns. Adjust stop-losses and take-profits as necessary to align with these indicators.
- Volatility Management: Given the high ATR, be prepared for significant price swings. Ensure that stop-loss and take-profit levels account for this volatility to avoid premature trade exits.
Additional Considerations
- Market Sentiment: Regularly update your understanding of the market sentiment through financial news and market analysis reports, focusing on changes in investor attitude towards gold.
- Position Sizing: Adjust the size of positions in response to increases in volatility and risk, ensuring that each trade represents only a reasonable portion of the trading capital to maintain risk management discipline.
- Reevaluation of Probabilities: If significant new information becomes available, reassess the likelihoods of the bullish, bearish, and consolidation scenarios, and adjust strategies accordingly.
This strategy is designed to capitalize on the current technical and fundamental setups in the gold market, aiming to effectively manage risk and exploit potential profitable opportunities from both bullish and bearish movements in the price of gold over the next five trading days.
To know more about CMS Prime visit us at https://cmsprime.com
Disclaimer: This is not an Investment Advice. Investing and trading in currencies involve inherent risks. It’s essential to conduct thorough research and consider your risk tolerance before engaging in any financial activities.