Current Factors Influencing Current Gold Prices:
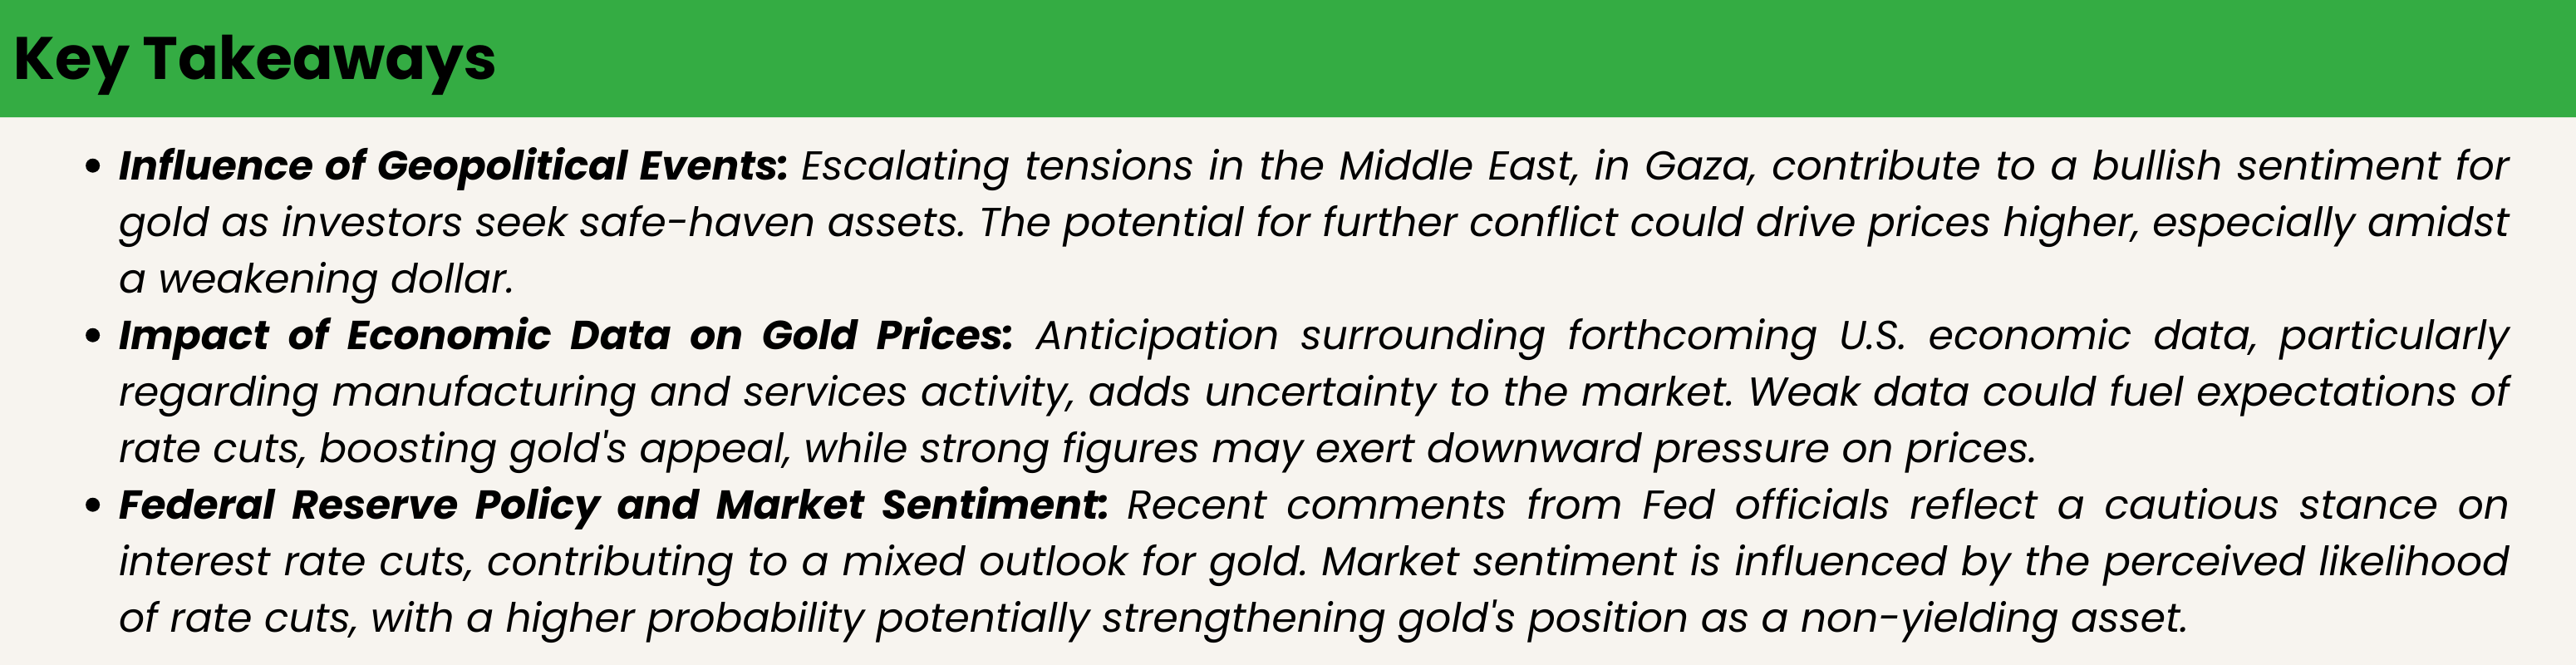
- Gold prices rose slightly on Thursday, supported by a weakening dollar and heightened tensions in the Middle East. Investors were also anticipating further U.S. economic data to gauge the Federal Reserve’s stance on interest rates.
- Spot gold was up 0.3% at $2,031.7 per ounce, reaching its highest level since February 9th on Wednesday. U.S. gold futures also increased by 0.3% to $2,041.2 per ounce.
- The dollar index continued to decline for the fourth consecutive session, making gold more attractive to international buyers.
- Tim Waterer, chief market analyst at KCM Trade, noted that the short-term outlook for gold is mixed. While delays in rate-cutting plans may temper gains, safe-haven demand stemming from geopolitical tensions provides support.
- Israel escalated its attacks on Rafah in Gaza, resulting in casualties, amid ongoing conflict in the region.
- Economic data on manufacturing and services activity awaited, with potential signs of weakness possibly spurring hopes for rate cuts, thereby benefiting gold.
- Attention focused on forthcoming data on initial jobless claims, as well as flash U.S. manufacturing and services figures.
- Minutes from the Fed’s recent meeting revealed concerns among policymakers about the risks of premature interest rate cuts.
- Richmond Fed President Thomas Barkin commented on January’s inflation data, which surpassed expectations, complicating future rate decisions.
- Market expectations currently imply a 72% likelihood of a rate cut in June, according to the CME Fed Watch Tool, with lower rates enhancing gold’s appeal as a non-yielding asset.
Fundamental and Technical Analysis

Technical Overview:
Technical Landscape:
The current gold chart shows that the market is hovering around key technical levels:
Support and Resistance:
- Gold faces immediate resistance near the $2040.00 level, which if breached, could see the metal target the psychological resistance at $2052.
- On the downside, support lies around the $2023 mark, with further support near the $2009 level, closely aligning with the 1.272 Fibonacci retracement.
VWAP Bands:
- The price is currently situated between the VWAP middle and upper bands, suggesting a neutral to mildly bullish short-term sentiment among market participants.
Momentum Indicators:
- The ATR shows decreased volatility, suggesting a potential consolidation phase.
- Momentum is relatively flat, indicating a lack of strong directional movement.
Fundamental Context:
The geopolitical tensions and a weaker dollar provide a supportive backdrop for gold prices, juxtaposed against the anticipation of economic data:
Geopolitical Tensions:
- Escalations in the Middle East could bolster gold’s safe-haven demand, potentially driving prices up.
Economic Data:
- Upcoming U.S. economic data will be scrutinized for indications of economic softness, which could lead to a dovish shift in the Fed’s stance.
Federal Reserve Sentiment:
- Recent comments by Fed officials reflect caution against premature rate cuts, signaling a hesitance to change the current monetary policy.
Scenario Analysis:
Bullish Scenario (40% Probability):
- A deterioration in geopolitical situations or weaker-than-expected U.S. economic figures could spur a rally past $2066.246, targeting the next resistance level.
- Price Target: $2040 – $2050
- Sentiment Analysis: Positive sentiment could increase, with geopolitical risks and economic data driving safe-haven demand.
Bearish Scenario (30% Probability):
- Strong economic data or hawkish Fed rhetoric could push gold below the support at $2023.699, with a move towards the $2003 mark.
- Price Target: $2016 – $2009
- Sentiment Analysis: Negative sentiment predominates as higher rates diminish gold’s non-yielding asset appeal.
Neutral Scenario (30% Probability):
- Mixed economic data and ongoing geopolitical concerns could see gold prices oscillate within the current range, bounded by $2016 and $2037.
- Price Target: $2016 – $2037
- Sentiment Analysis: Neutral sentiment reflects market uncertainty and balanced cross-currents from geopolitical and economic factors.
Overall Market Sentiment Forecast:
- Positive Sentiment: Moderated to 30% in light of possible geopolitical escalations and dovish economic triggers.
- Negative Sentiment: Strengthened to 40% due to the potential for continued hawkish Fed policy.
- Neutral Sentiment: Maintained at 30%, signifying the market’s cautious stance amid mixed signals.
Overall Market Sentiment: 40% Positive, 30% Negative, 30% Neutral.
Target Levels and Analysis--- 2040-2050 or 2009-2023
Strategy Foundation
Market Condition Assessment:
- The analysis reflects a scenario where gold is buoyed by a weakening dollar and geopolitical tensions, set against the backdrop of anticipation for U.S. economic data that could influence the Federal Reserve’s interest rate decisions.
Scenario-based Approach:
- Bullish Scenario: Given a 40% probability, with the potential to push gold towards the $2050-$2056 range amid geopolitical tensions or dovish economic indicators.
- Bearish Scenario: A 30% probability scenario that could see gold retreating towards the $2021-$2009 range, driven by strong economic data or hawkish Fed rhetoric.
- Neutral Scenario: Also holding a 30% probability, where gold oscillates within a tight range due to mixed signals from economic data and geopolitical developments.
Strategic Implementation
For the Bullish Price Target ($2050-$2056):
- Entry Point: Position for long entries as gold approaches the lower end of the resistance at $2040, or upon a breakout above this level, indicating a shift towards bullish momentum.
- Stop-Loss: Set stop-loss orders just below the immediate support level at $2023 to limit potential downside risks.
- Profit Target: Aim for the profit target within the $2050-$2056 range, staying alert to any signs of reversal that could cap gains.
For the Bearish Price Target ($2021-$2009):
- Entry Point: Initiate short positions if gold fails to breach the $2040 resistance or upon breaking below the $2023 support, signaling bearish momentum.
- Stop-Loss: Place stop-loss orders slightly above the $2040 level to protect against an unexpected bullish turnaround.
- Profit Target: Set the initial profit target within the $2021-$2009 range, adjusting the target based on evolving market dynamics and resistance levels encountered.
Risk Management and Market Monitoring
- Position Sizing: Balance the trade sizes based on the assessed probability of each scenario’s realization and the overall risk tolerance.
- Sentiment and Technical Reassessment: Continuously monitor market sentiment, geopolitical developments, and economic data releases for signs that could necessitate strategy adjustments.
- Flexibility and Adaptation: Be prepared to dynamically adjust the strategy in response to new information or shifts in the technical and fundamental landscape.
Conclusion
This strategy is crafted to exploit potential movements within the specified bullish and bearish price target zones of gold, leveraging an analytical approach that considers the current balance of geopolitical risks, economic data expectations, and Federal Reserve policy outlook. By applying disciplined entry, stop-loss, and profit target mechanisms, and maintaining an agile stance ready to adapt to market shifts, traders can navigate the complexities of the gold market with a strategic edge. Continuous engagement with market developments and sentiment analysis will be key to refining the approach as conditions evolve.
To know more about CMS Prime visit us at https://cmsprime.com
Disclaimer: This is not an Investment Advice. Investing and trading in currencies involve inherent risks. It’s essential to conduct thorough research and consider your risk tolerance before engaging in any financial activities.