
1.Validating Trends (What and Why)
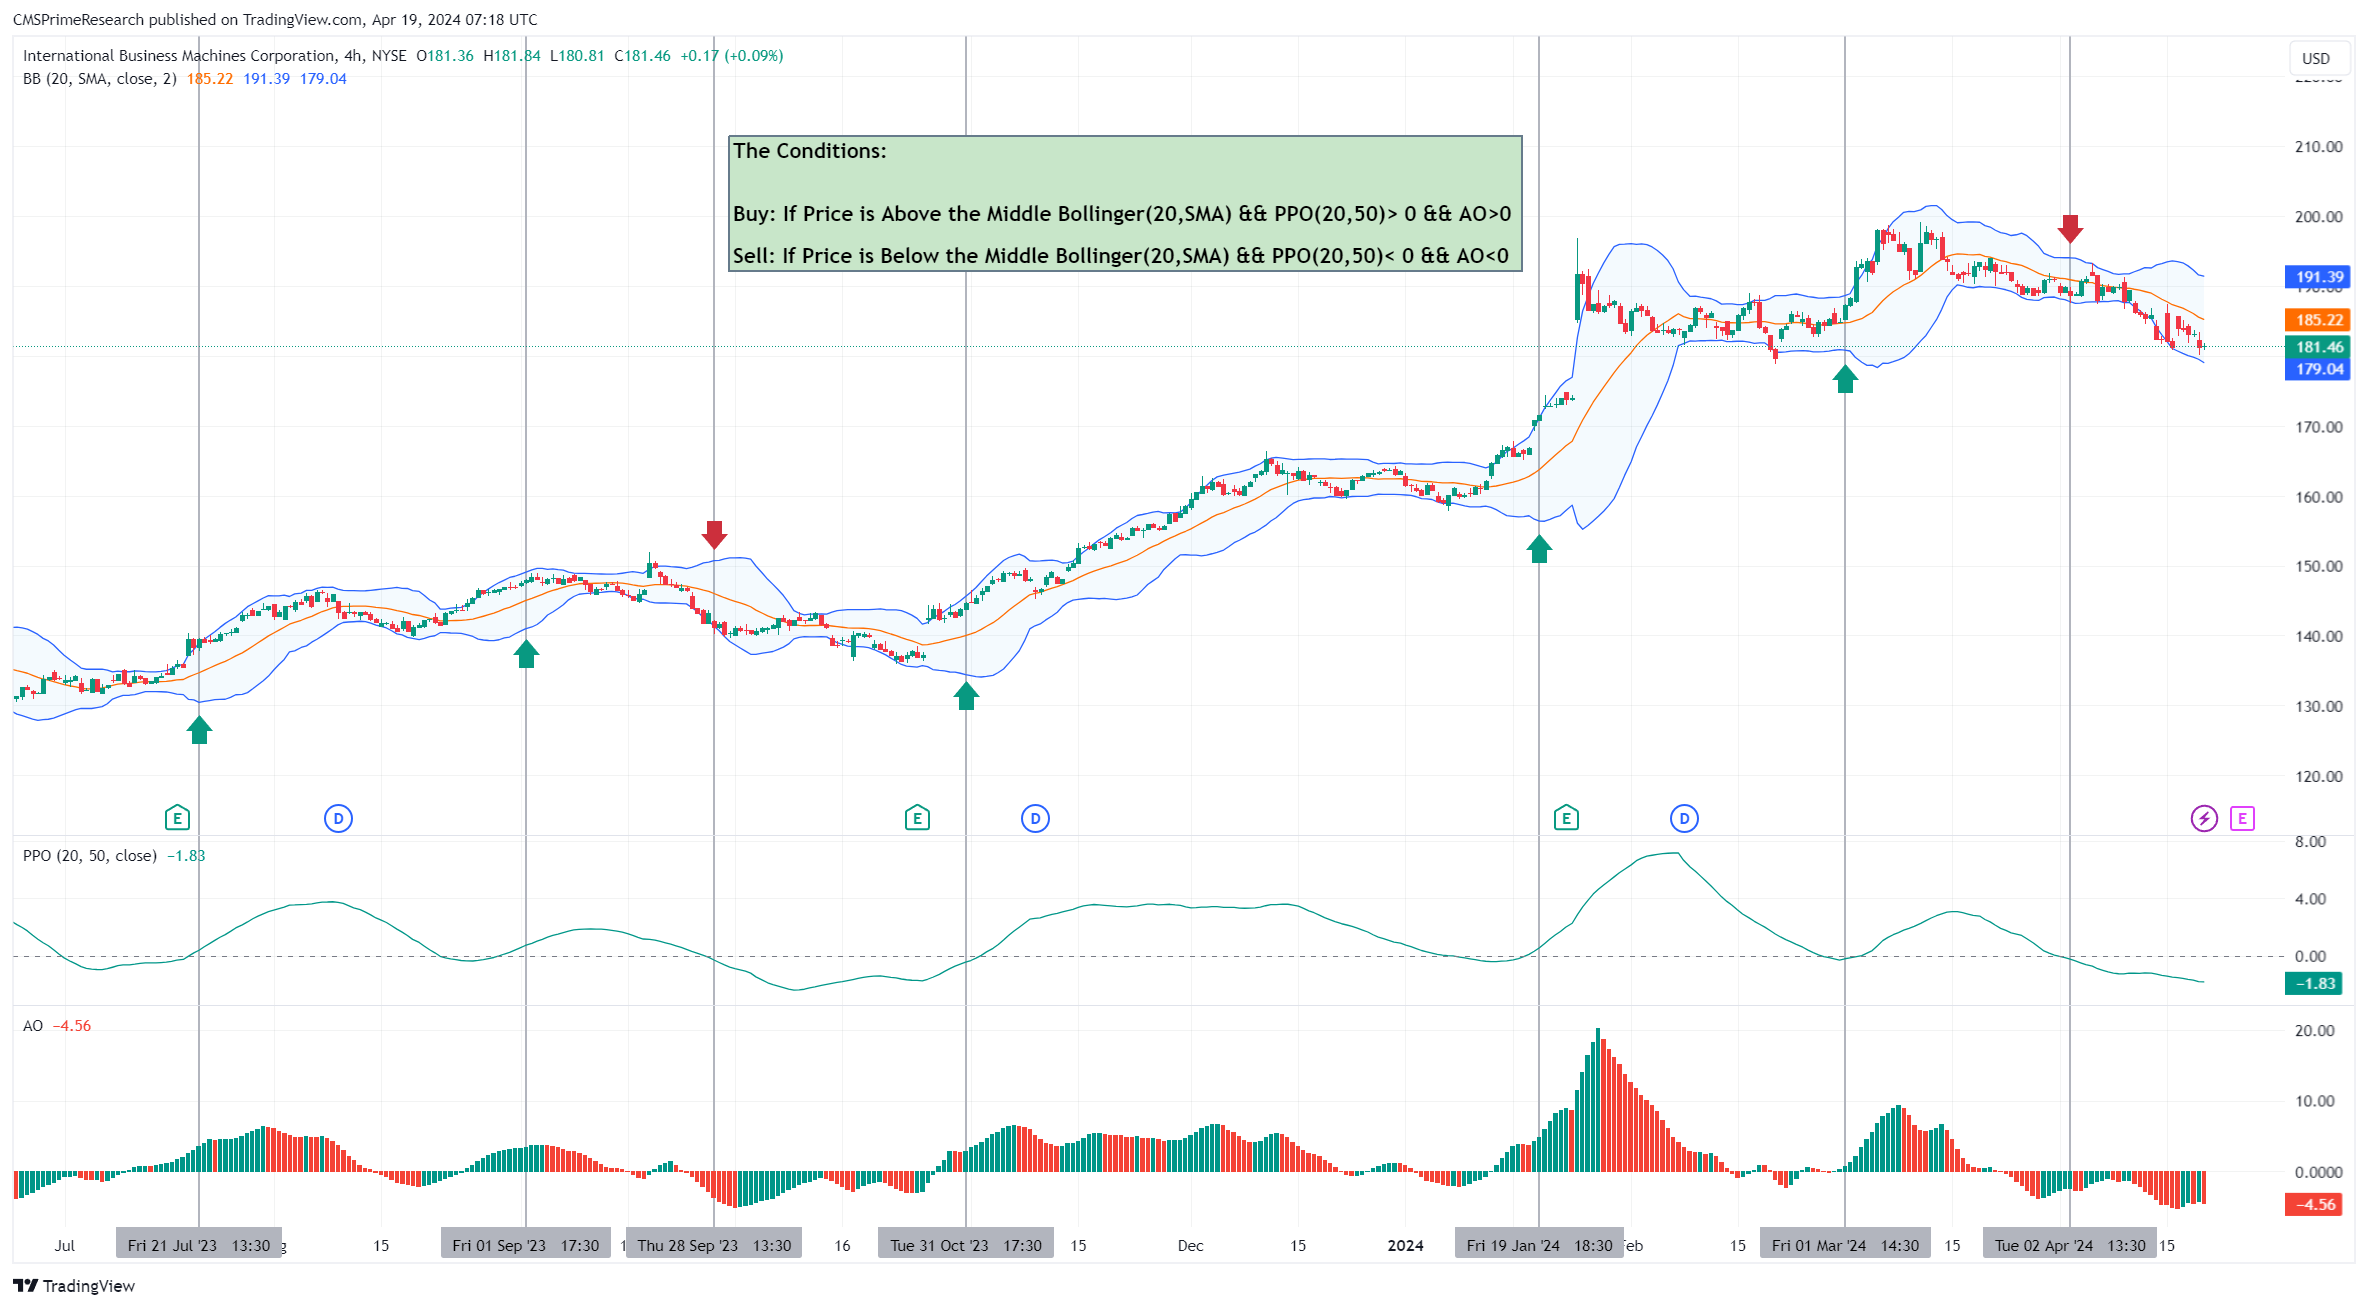
What; To pinpoint the market trend this approach utilizes the middle Bollinger Band (20, SMA) alongside PPO (20,50). The Bollinger Band establishes a fluctuating level that prices tend to gravitate towards offering insight into trend direction based on how prices relate to this central band. The PPO assesses momentum by comparing two moving averages across varying time frames unveiling the potency of the trend.
Why: Identifying trends is pivotal in trading to align with market movements and steer clear of trades that could heighten potential losses. By integrating PPO with Bollinger Bands traders can validate trend robustness and longevity boosting decision making precision.
How: A scenario where prices surpass the middle Bollinger Band while maintaining a PPO signifies a robust upward trend signaling a buying opportunity. Conversely if prices dip below the band with a negative PPO it indicates a downward trend prompting a selling stance. This dual confirmation mechanism aids, in filtering out signals and enhancing the reliability of trend forecasts.
2. Monitoring Momentum Shifts and Detecting Market Biases (What and Why)
The Awesome Oscillator (AO) is used to gauge the momentum and potential bias of the market. By computing the SMA of midpoints over two periods the AO can indicate the driving force of the market and unveil shifts in market psychology or dynamics before they manifest in price movements.
Understanding shifts in momentum and underlying biases is crucial for predicting trend reversals or continuations. This becomes especially valuable in markets, where early identification of momentum changes can offer strategic advantages.
Positive AO values signal buying pressure ( bias) while negative values indicate selling pressure (bearish bias). When combined with trend data from Bollinger Bands and PPO traders can better assess entry and exit points optimizing their trading positions based on prevailing biases and momentum trends.
3. Comprehensive Risk Management:
This strategy combines these indicators to establish a layered risk management approach that requires multiple confirmations before initiating a trade. This layered confirmation process helps mitigate risks associated with market conditions.
Effective risk management is essential, for trading as it reduces potential losses while maximizing potential gains.
Utilizing a combination of indicators in a coherent manner aids in sorting through irrelevant data and enhancing signal quality.
The process involves waiting for all indicators to align before generating a trade signal, which serves as a safeguard against false signals. For instance a buy signal is only confirmed if the price surpasses the middle Bollinger Band the PPO shows positivity and the AO also indicates positivity. This triple validation process ensures that trades are in line with both the trend and momentum thus reducing the likelihood of making incorrect entries.
In summary incorporating Bollinger Bands, PPO and AO within this trading system establishes a structured approach, for interpreting market trends recognizing biases and effectively managing trading risks. This holistic strategy addresses queries regarding existing trends or biases their significance and outlines strategic ways to engage with them to optimize trading results.
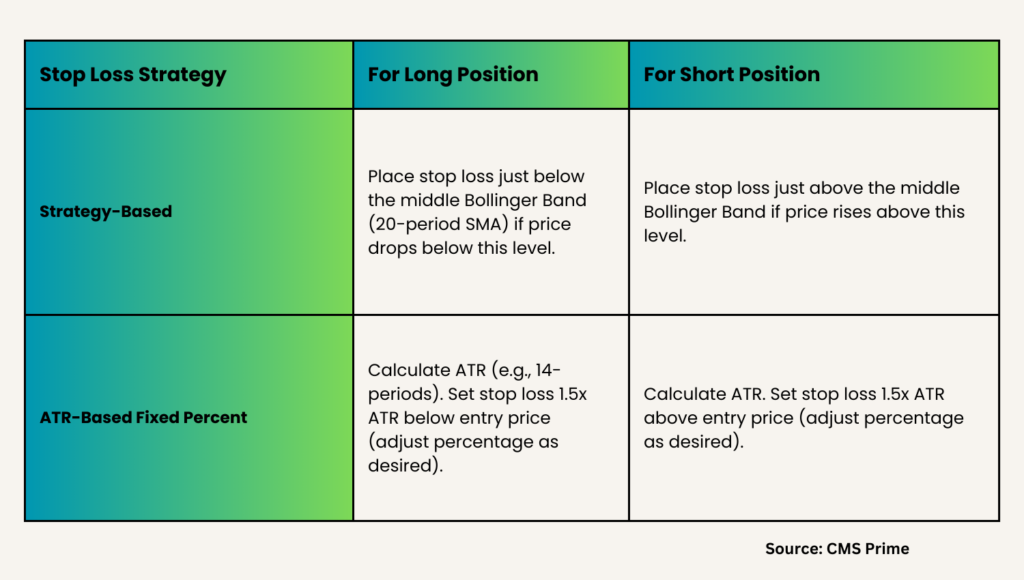
In the context of the given trading strategy, which includes Bollinger Bands, Percentage Price Oscillator (PPO), and Awesome Oscillator (AO), we can formulate two stop-loss strategies: one that incorporates the strategy itself as a stop-loss level and another based on a fixed percent method utilizing Average True Range (ATR). Here are the two strategies explained:
1. Strategy-Based Stop Loss
In a strategy-based stop-loss approach, the stop-loss level is set according to the signals generated by the trading strategy’s indicators. This ensures that the stop loss is dynamically adjusted based on the market conditions as reflected by the indicators.
For a Long Position:
- Stop Loss below Middle Bollinger Band: When entering a long position as the price moves above the middle Bollinger Band, place a stop loss just below the middle Bollinger Band (20-period SMA). If the price drops below this level, it could indicate a potential trend reversal or loss of upward momentum, justifying the closure of the position.
For a Short Position:
- Stop Loss above Middle Bollinger Band: When taking a short position as the price drops below the middle Bollinger Band, place the stop loss just above this band. If the price moves above this level, it suggests that the downward trend may be losing strength, warranting an exit from the short position.
This strategy-based stop loss is adaptive and moves with the indicators, providing a dynamic approach to managing risk that is in line with the overall trading system.
2. Fixed Percent Method Based on ATR
The Average True Range (ATR) is a measure of market volatility over a specified period. A fixed percent method using ATR establishes the stop-loss level at a certain percentage of the ATR away from the entry point.
For a Long Position:
- ATR Stop Loss: Calculate the current ATR value for the desired period (typically 14-periods is used). Set the stop loss a fixed percentage below the entry price. For instance, if using 1.5 times the ATR and the ATR is $2, the stop loss would be set 1.5 * $2 = $3 below the entry price.
For a Short Position:
- ATR Stop Loss: Similarly, for a short position, set the stop loss a fixed percentage above the entry price. If the ATR is $2 and we use 1.5 times the ATR, then the stop loss would be $3 above the entry price.
The ATR-based stop loss accommodates changing market volatility and adjusts the risk level accordingly. It ensures that the stop loss is wider during high volatility periods, avoiding premature exits due to normal price fluctuations, and tighter during low volatility periods, protecting profits and reducing risk.
Both these stop-loss strategies serve different purposes. The strategy-based stop loss aligns closely with the trading signals, ensuring consistency with the trading plan. In contrast, the ATR-based fixed percent method provides a volatility-adjusted approach, which might be preferred by traders who are focused on managing the risk relative to market conditions rather than specific indicator signals.