Skip links

Trading Strategy Design Using ADX ,DPO and SMA

Trend Perspective and Justifications:

Key Indicators Utilized in the Strategy
50 period Simple Moving Average (SMA): This tool is used to gauge the overall market direction. When the price is higher than the SMA, it usually signifies an upward trend.
21 period Detrended Price Oscillator (DPO): The DPO assesses how far the recent price deviates from an average, focusing on short term trends by removing longer cycles. A DPO reading above zero indicates that the price is surpassing its typical trend cycle.
Directional Movement Index (DMI): Comprising DMI Plus and DMI Minus, this indicator assists in determining price movement direction. When DMI Plus crosses above DMI Minus, it suggests a strengthening uptrend and vice versa.

Advantages:
Clarity and Simplicity: The approach relies on clear technical cues to decide when to enter and exit trades, making it easy to automate or follow manually.
Objective Decision Making: By offering precise, rule based guidelines for trading, this strategy helps reduce emotional influences on decision making.

Disadvantages:
Delayed Indicators: Since all three indicators depend on historical price data, they may not accurately forecast future price movements, causing delays in responding to real market shifts.
False Signals: Technical indicators have the potential to produce inaccurate signals during unexpected market fluctuations or unusual price changes, which could result in losses.
Market Conditions: The effectiveness of this strategy can fluctuate significantly depending on market conditions. For instance, in a highly volatile market, the SMA and DPO indicators may not adapt swiftly enough, leading to misleading signals.

Do the signals Hold Good?

Based on  chart, for technical analysis for Advanced Micro Devices, Inc. (AMD) on NASDAQ along with suggestions for a trading approach, we can study the patterns in the chart and explain the rationale behind the strategy’s elements and goals.

Purpose of the Strategy:
The strategy aims to capture the following aspects:

Identifying Trend Reversals: By utilizing SMA(50), the strategy intends to assess the overall market sentiment. A price above SMA(50) generally indicates positive sentiment, while a price below it may suggest bearish sentiment.
Monitoring Short term Price Oscillation: DPO(21) is employed to recognize cyclic price movements by removing trends. A positive DPO indicates that prices are higher than their detrended average, possibly hinting at an upward price movement within the broader trend.
Assessing Trend Strength and Direction: The DMI indicators, including DMI Plus and DMI Minus, are utilized to evaluate trend direction and strength. The intersection of these two lines can signal potential shifts in price momentum and trend strength.

Examining Chart Patterns:
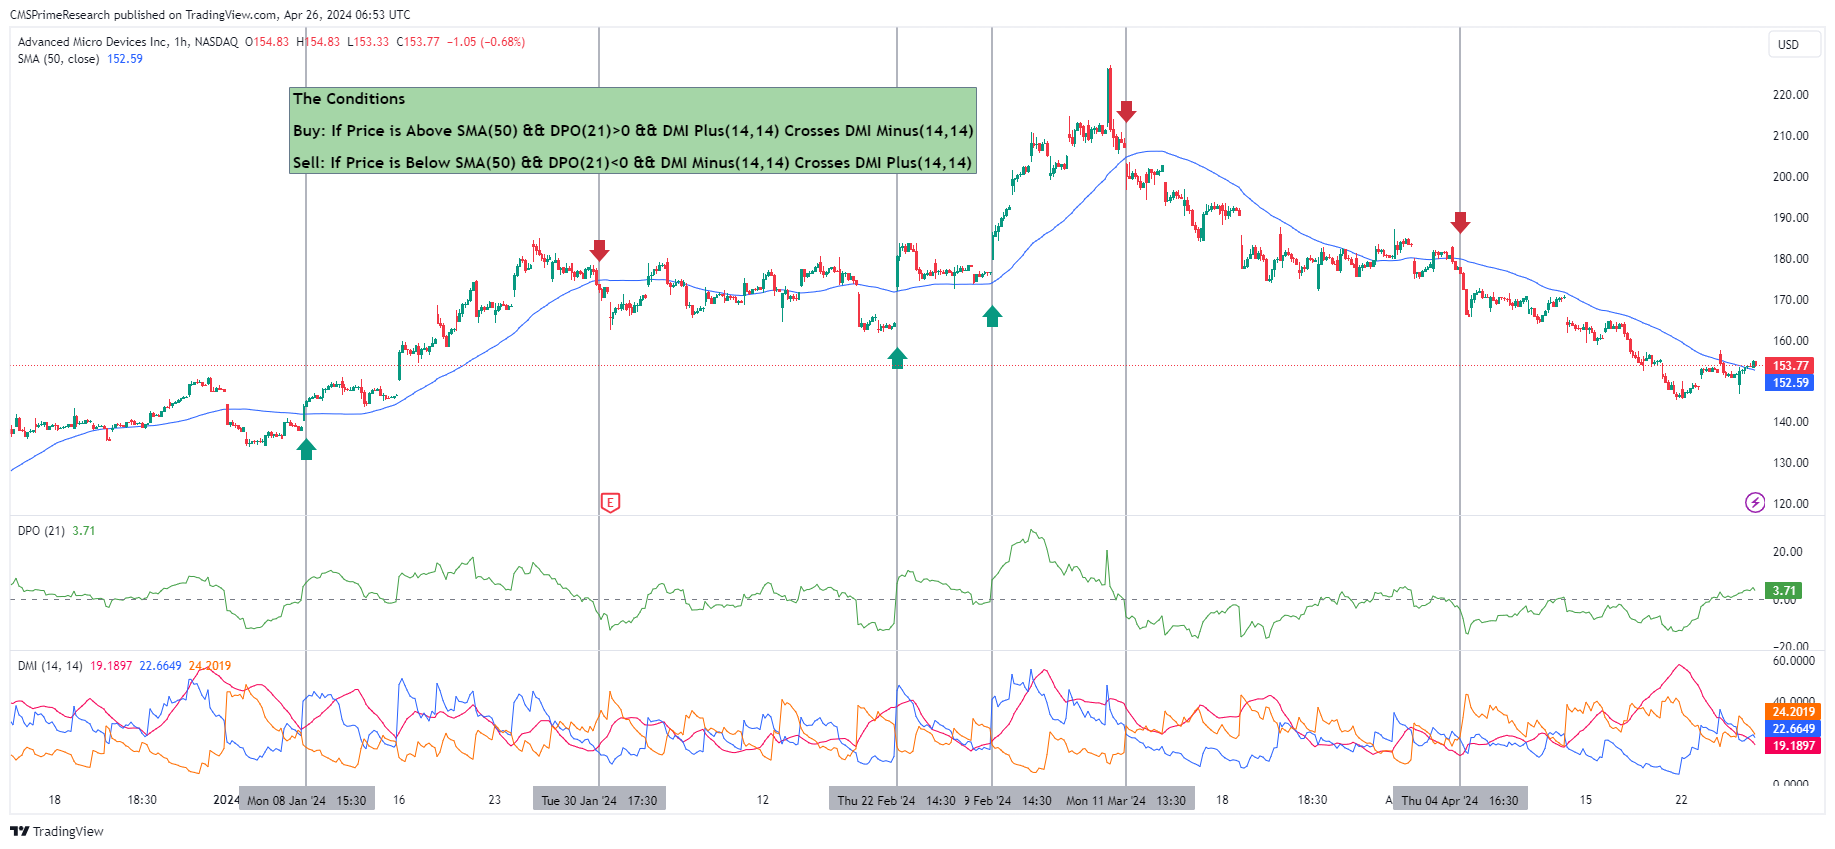
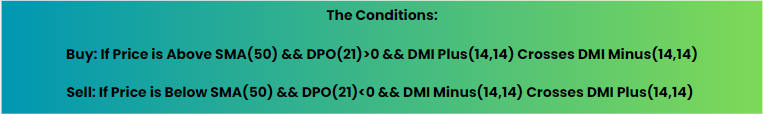
SMA(50):The blue line denotes SMA(50), acting as a reference point for determining trend direction. The approach suggests purchasing when the price is higher than this threshold and selling when it falls below, assuming that prices typically follow the trend’s direction.

DPO(21): The DPO line is displayed in the second section and moves around a zero line. Positive values indicate a potential continuation of an upward trend, while negative values imply a possible downward trend or price pullback.

DMI Indicators: The lower section showcases the DMI indicators. When the DMI Plus (blue line) crosses above the DMI Minus (orange line), it is seen as a bullish signal, whereas the opposite scenario is viewed as bearish.

The Strategy’s Sound Logic:
Why It’s Effective:
Blend of Indicators: This approach combines signals from various technical indicators to enhance the likelihood of making sound decisions. Instead of relying on just one indicator, it waits for multiple indicators to align, filtering out weaker signals in the process.
Confirmation of Momentum: The DMI crossover acts as a confirmation of momentum, a common practice in trend following strategies. The aim is to enter trades when there is substantial evidence of a strong trend.

Potential Limitations:
Delayed Impact of SMA: The SMA(50) lags behind market movements as it is based on past prices. In rapidly changing markets, this indicator may not accurately reflect the current trend, resulting in delayed trade entries or exits.
Risk of False DPO Signals: The DPO(21) can generate misleading signals during volatile sideways movements, potentially causing premature trade entry or exit decisions.

Operational Approach:
Signal Driven Trading: This strategy functions by producing buy or sell signals based on predefined conditions. Successful implementation requires disciplined action from traders to promptly respond to these signals and capitalize on emerging trends.

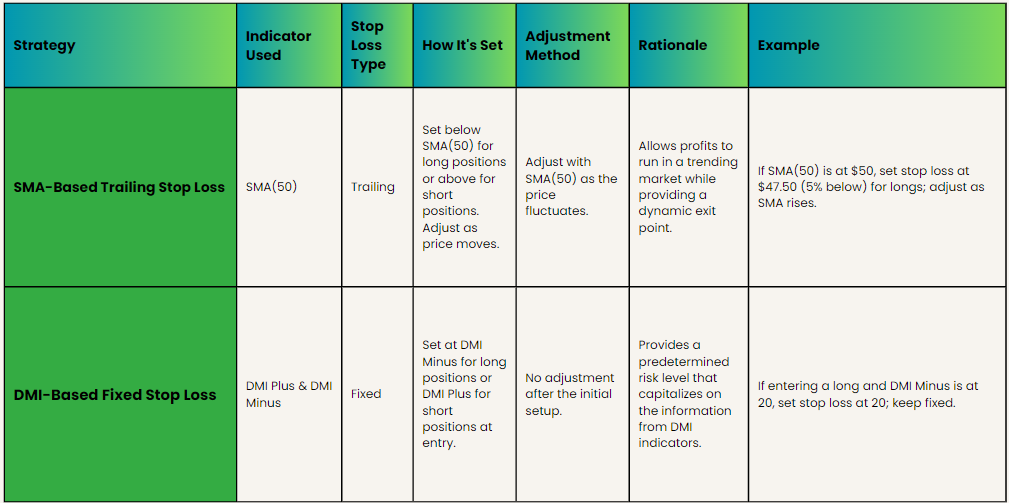
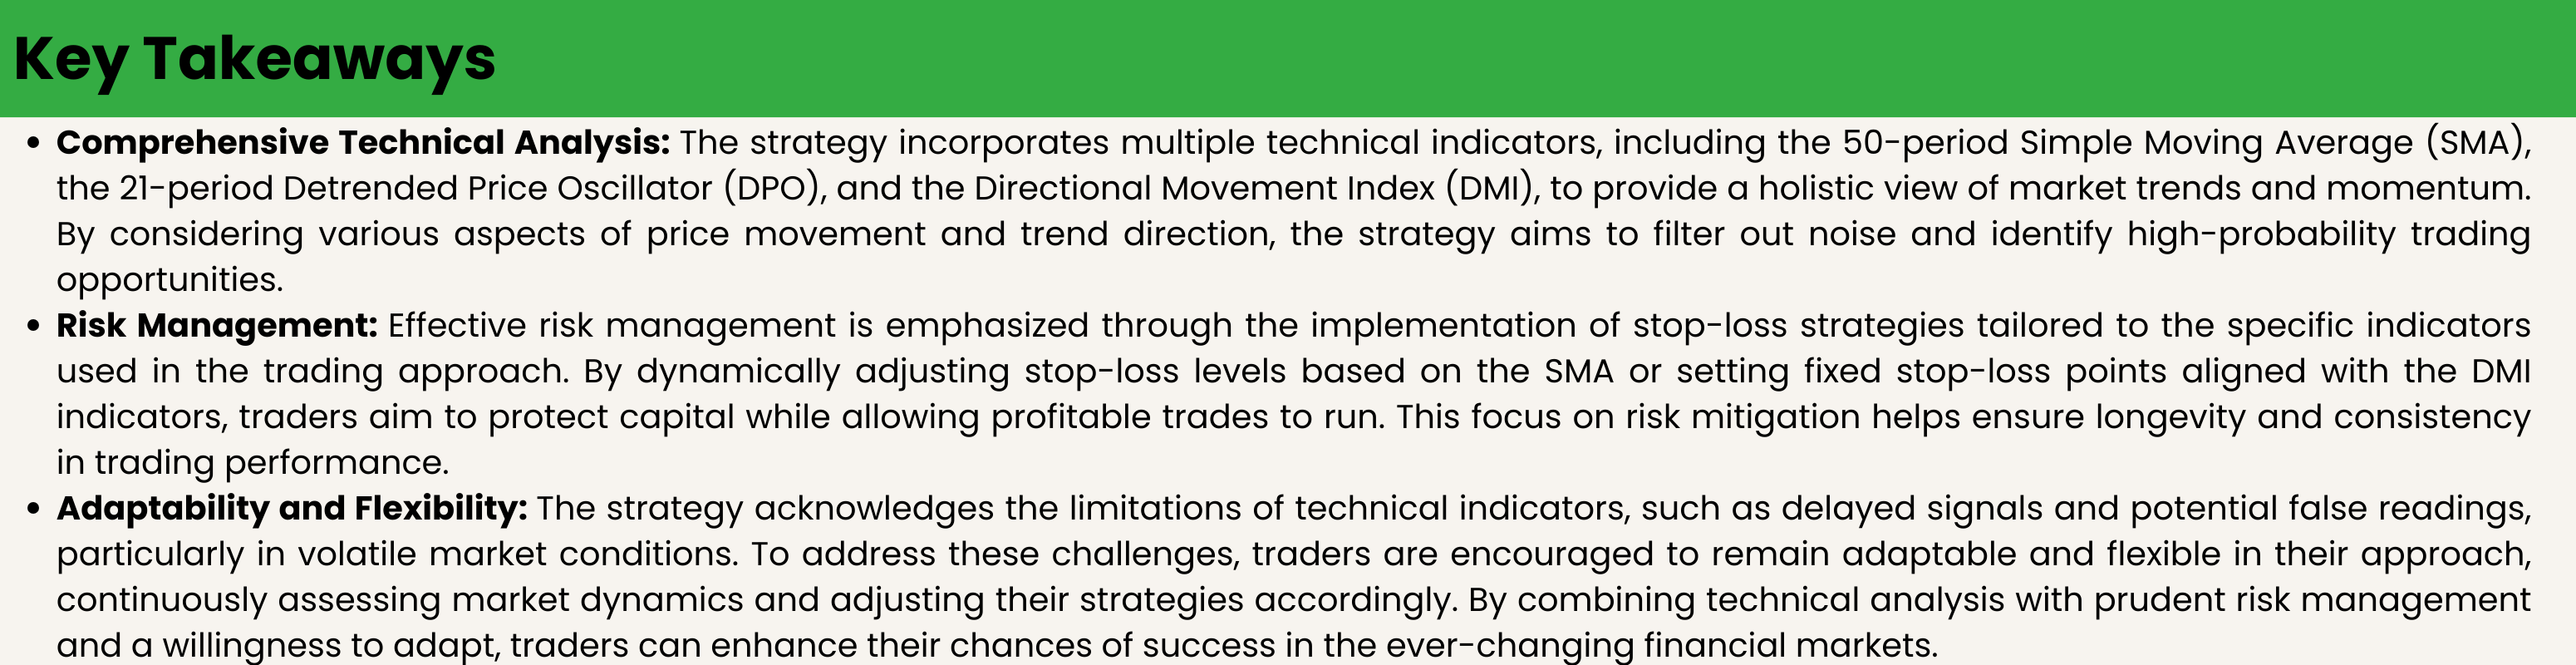
Risk management is a crucial aspect of any strategy, involving actions such as setting stop losses and taking profits at specific levels to shield against sudden market changes and secure profits. To sum up, the strategy aims to methodically seize market trends and shifts in momentum by utilizing various indicators that assess different facets of market activity. This combination seeks to enhance the decision making process for entering and exiting trades, capturing the ‘what’ (price movements), ‘why’ (market momentum and trends) and ‘how’ (through signals based on indicators) of trading.
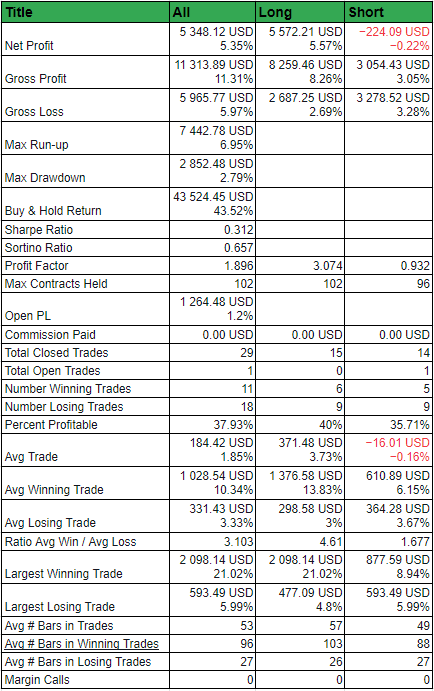
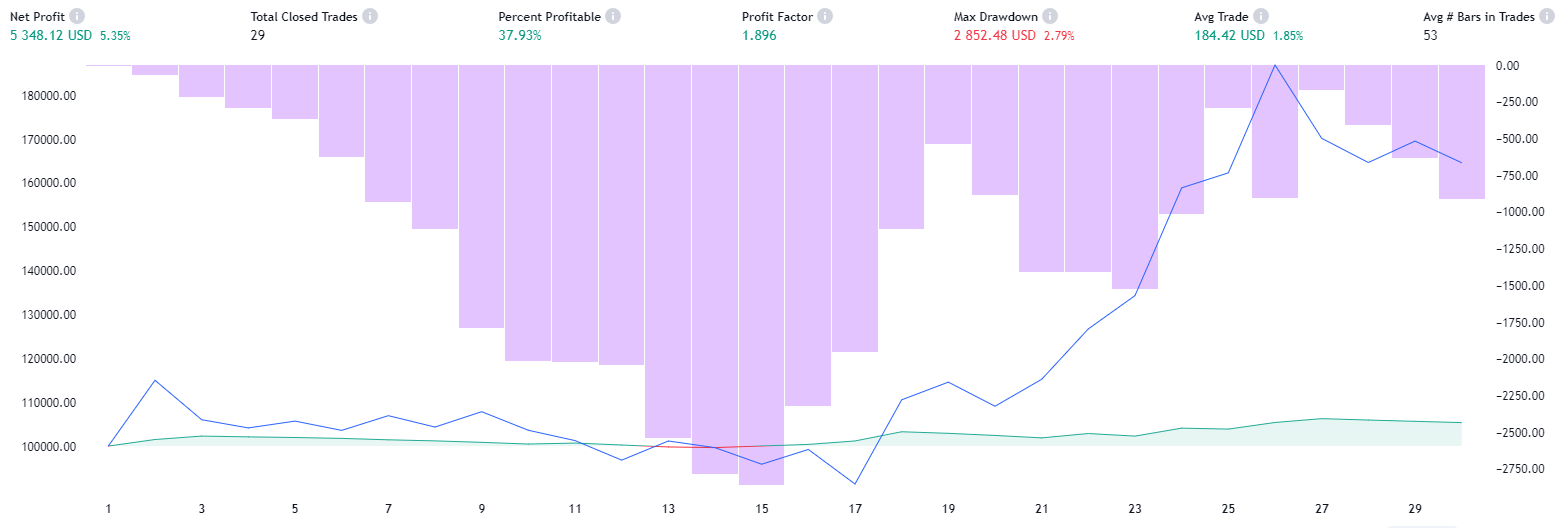
Backtesting Framework

Analyzing the backtest results requires examining several key performance metrics to assess the effectiveness and profitability of the strategy. Here’s a breakdown of the major components and what they indicate:

Overall Performance:
  • Net Profit: The strategy shows a positive net profit, which is a good sign. The long positions have contributed significantly to the net profit, while the short positions have resulted in a small loss.
  • Gross Profit vs. Gross Loss: The ratio of gross profit to gross loss is quite favorable, especially for long trades. This suggests that the strategy is effectively capturing profitable trades more than losing ones, particularly on the long side.
Risk Assessment:
  • Max Drawdown: The maximum drawdown is relatively small compared to the net profit, which indicates that the strategy doesn’t suffer from large declines in equity, implying good risk management.
  • Sharpe Ratio: The Sharpe ratio is above 0, which is positive, but it’s not particularly high, suggesting that the excess return over the risk-free rate is moderate. A higher Sharpe ratio would indicate a better risk-adjusted return.
  • Sortino Ratio: The Sortino ratio is also positive and higher than the Sharpe ratio, which means the strategy is doing a better job of earning returns in excess of the downward deviation (or downside risk)

Trade Analysis:
  • Profit Factor: The profit factor, especially for long trades, is high. A profit factor above 1 indicates a profitable strategy, and this strategy’s profit factor is well above 1 for long trades, highlighting its effectiveness.
  • Percent Profitable: A high percentage of trades are profitable (37.93% overall), which is encouraging. However, it’s worth noting that less than half of all trades are profitable, meaning the strategy likely has a few trades with high returns that are driving the net profit.
  • Average Trade: The average trade is positive, which is another indicator of a profitable strategy. The average winning trade is significantly higher than the average losing trade, particularly for long positions.
Individual Trade Performance:
  • Largest Winning vs. Losing Trade: The largest winning trade is substantially higher than the largest losing trade, which could indicate that the strategy effectively lets winners run and cuts losses early.
  • Ratio Avg Win / Avg Loss: The ratio of average win to average loss is greater than 1 for both long and short trades, meaning that the wins are larger than the losses on average.
Two Stop Loss Strategies

 
Incorporating technical indicators into stop-loss strategies can enhance risk management by providing dynamic, market-informed exit points. Here are two stop-loss strategies based on the indicators from the provided strategy framework:
1. SMA-Based Trailing Stop Loss

How It Works:

  • Set the initial stop loss at a certain percentage or dollar amount below the 50-period SMA for long positions or above the SMA for short positions.
  • As the price moves favorably, adjust (trail) the stop loss to maintain the set distance from the SMA, locking in profits as the trend continues.
  • If the price reverses and crosses the SMA, indicating a potential trend reversal, the stop loss will be triggered, closing the position.

Why Use It:

  • The SMA serves as a dynamic baseline that reflects the changing market conditions. It often acts as a support level in uptrends and a resistance level in downtrends.
  • By trailing the SMA, the strategy allows for some price fluctuation while still protecting from significant adverse moves.

Example:

  • For a long position, if the SMA(50) is at $50 and the chosen stop loss is 5% below the SMA, the initial stop loss would be set at $47.50. As the price and SMA increase, the stop loss is adjusted upwards accordingly.
2. DMI-Based Fixed Stop Loss

How It Works:

  • This strategy uses the levels of the DMI Plus and DMI Minus lines as a basis for the stop loss.
  • For a long position, set the stop loss at the level where the DMI Minus is at the time of entry. For a short position, set the stop loss where the DMI Plus is at the time of entry.
  • The stop loss remains fixed and does not trail the price.

Why Use It:

  • The DMI indicators are designed to capture trend strength and direction. By setting the stop loss at the level of the opposite DMI line, you’re allowing the trade to withstand normal market volatility while still exiting if the trend shows signs of reversing.

Example:

  • Upon entering a long trade, if the DMI Minus value is 20 and the DMI Plus value is 30, the stop loss could be set at a value where the DMI Minus might cross above the DMI Plus, indicating weakening of the uptrend.

Both of these stop-loss strategies use the underlying logic of the indicators to set exit points that are informed by the market’s technical structure. The first method provides a dynamic approach that locks in profits, while the second offers a fixed risk level that capitalizes on the trend strength information provided by the DMI. When implementing these strategies, it’s crucial to consider the trade’s risk tolerance and overall market conditions, as well as the trader’s comfort level with the potential distance to the stop loss and the corresponding capital at risk.

To know more about CMS Prime visit us at https://cmsprime.com

Disclaimer: This is not an Investment Advice. Investing and trading in currencies, CFD’s  involve inherent risks. It’s essential to conduct thorough research and consider your risk tolerance before engaging in any financial activities.