
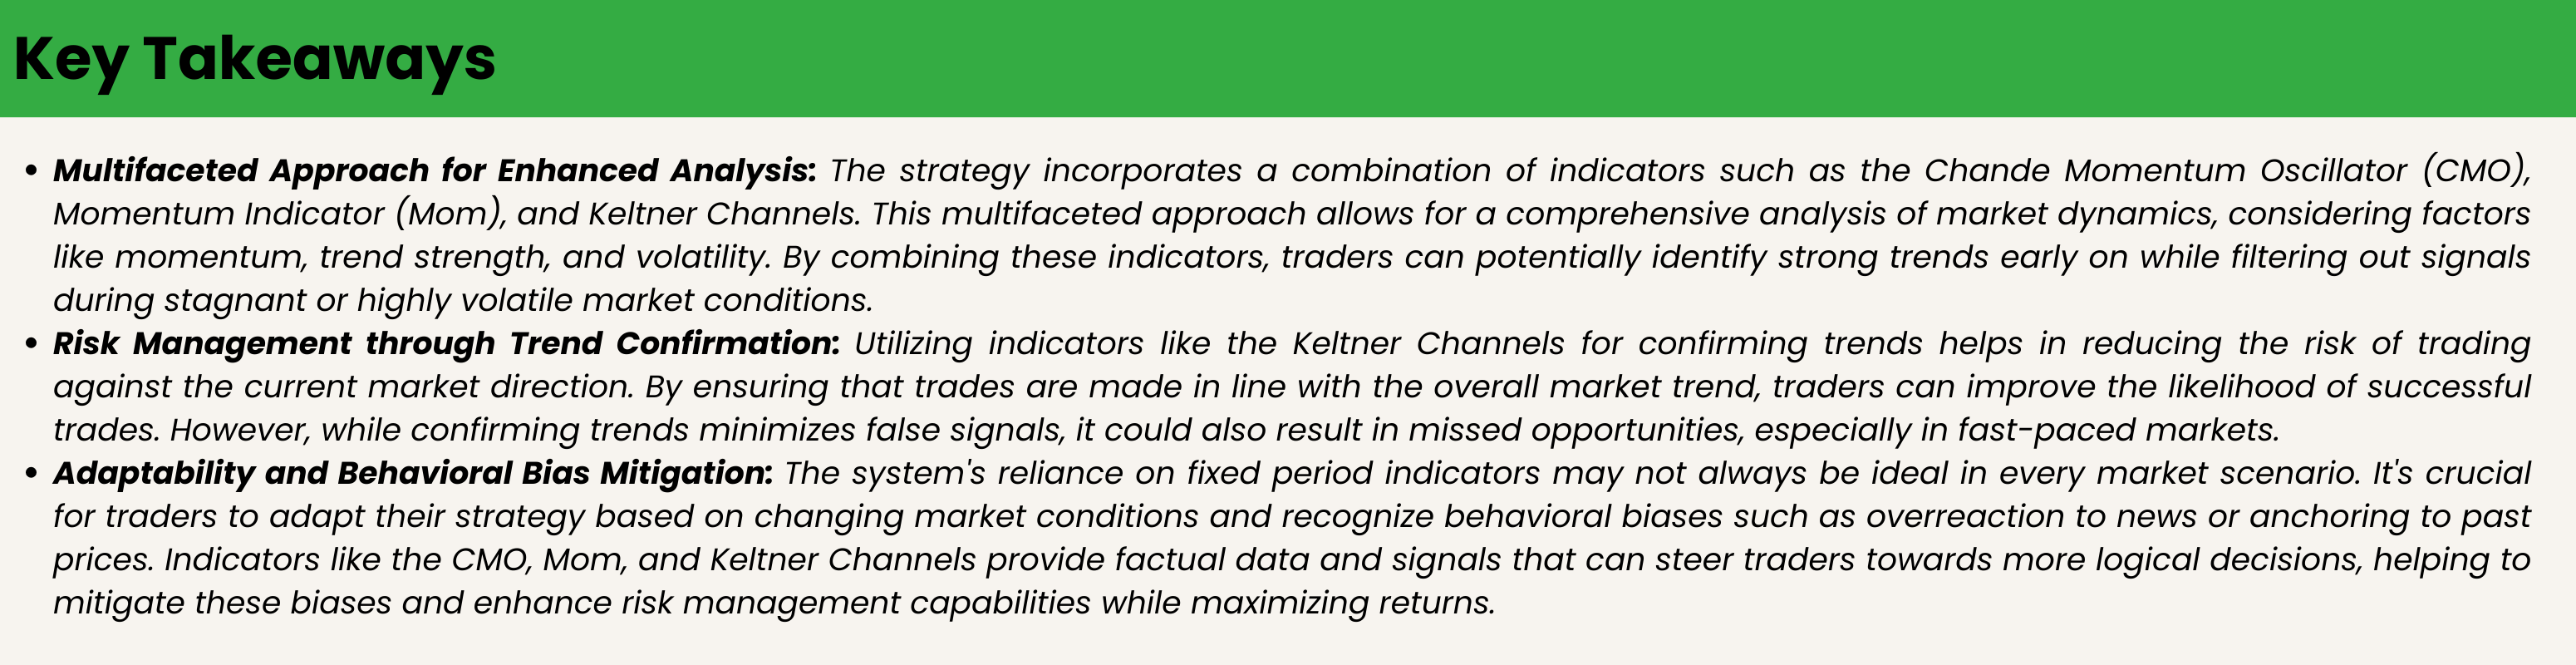
Incorporating a combination of the Chande Momentum Oscillator (CMO), Momentum Indicator (Mom), and Keltner Channels into a trading system offers a sophisticated approach for identifying trends, capturing breakouts, and managing risks, which can be crucial in navigating market biases and enhancing systematic trading processes. This multidimensional strategy leverages market volatility, momentum, and price trends in a holistic manner. Here’s a deeper dive into how this amalgamation can address market biases and differentiate the process, drawing from insights on Keltner Channels and their application in trading strategies.
System Development and Trend Pattern Recognition
Combining Volatility and Momentum
Keltner Channels provide a dynamic representation of market volatility and trend direction by adjusting their width based on the Average True Range (ATR), offering a smoother depiction of price movements compared to other volatility-based indicators. When combined with momentum indicators like the CMO and Mom, the system gains the ability to filter signals through a volatility-adjusted lens, ensuring that entries and exits are not just based on price momentum but are also contextualized within the current market volatility. This can be particularly effective in differentiating between false breakouts and genuine trend shifts.
Breakout Identification and Confirmation
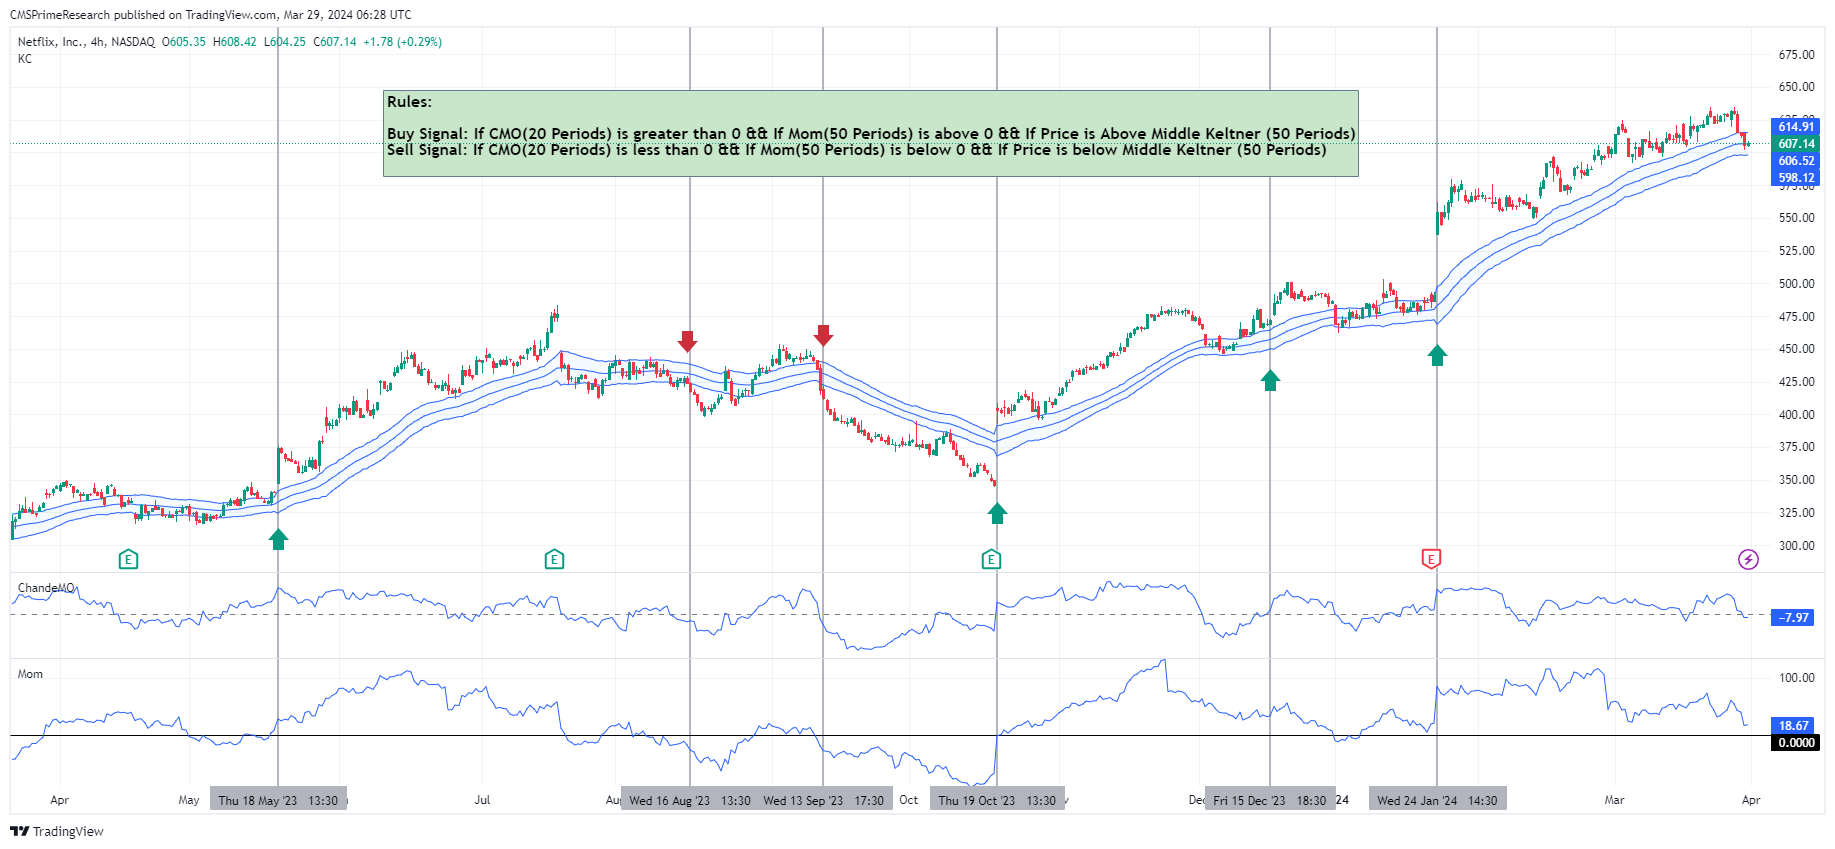
The structure of Keltner Channels facilitates the recognition of breakout opportunities. A breakout above the upper band signals potential bullish momentum, while a breakout below the lower band indicates bearish momentum. Integrating this with momentum indicators (CMO and Mom) can help confirm the strength and direction of the trend, providing a systematic approach to capturing shifts in market sentiment and dynamics. This combination effectively addresses the market bias toward trending or range-bound conditions, allowing for more nuanced decision-making
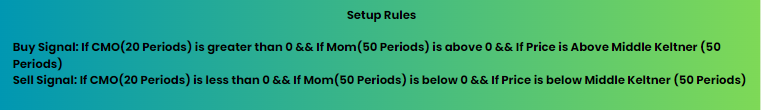
The Conditions:
Market Biases and Efficiency
Addressing Market Biases
Market participants often exhibit biases such as overreaction to news or underestimation of long-term trends. By systematically incorporating indicators that span volatility (Keltner Channels), momentum (CMO and Mom), and trend analysis, the strategy aims to mitigate these biases. It ensures that decisions are based on a balanced assessment of market conditions rather than on emotional reactions or singular viewpoints. The reliance on a structured rule-based system helps in disciplining the trading process and reducing cognitive biases.
Enhancing Market Efficiency
The strategic combination of these indicators aids in recognizing patterns and inefficiencies in the market. By backtesting and adjusting parameters such as the ATR multiplier for Keltner Channels or the periods for CMO and Mom, traders can refine their approach to better capture profitable opportunities across different market phases. This ongoing optimization process, grounded in historical data and performance metrics, contributes to a more efficient market engagement by continuously adapting to changing market conditions and recognizing shifts in market sentiment and volatility.
Through a comprehensive analysis, it’s clear that the integration of Keltner Channels with momentum indicators like CMO and Mom provides a robust framework for trend recognition, breakout confirmation, and risk management. This approach not only addresses market biases by offering a systematic method for trading decision-making but also enhances the ability to recognize and act on market inefficiencies. By incorporating a blend of volatility, momentum, and trend analysis, the strategy is well-equipped to navigate the complexities of financial markets, offering a differentiated process for achieving trading objectives.
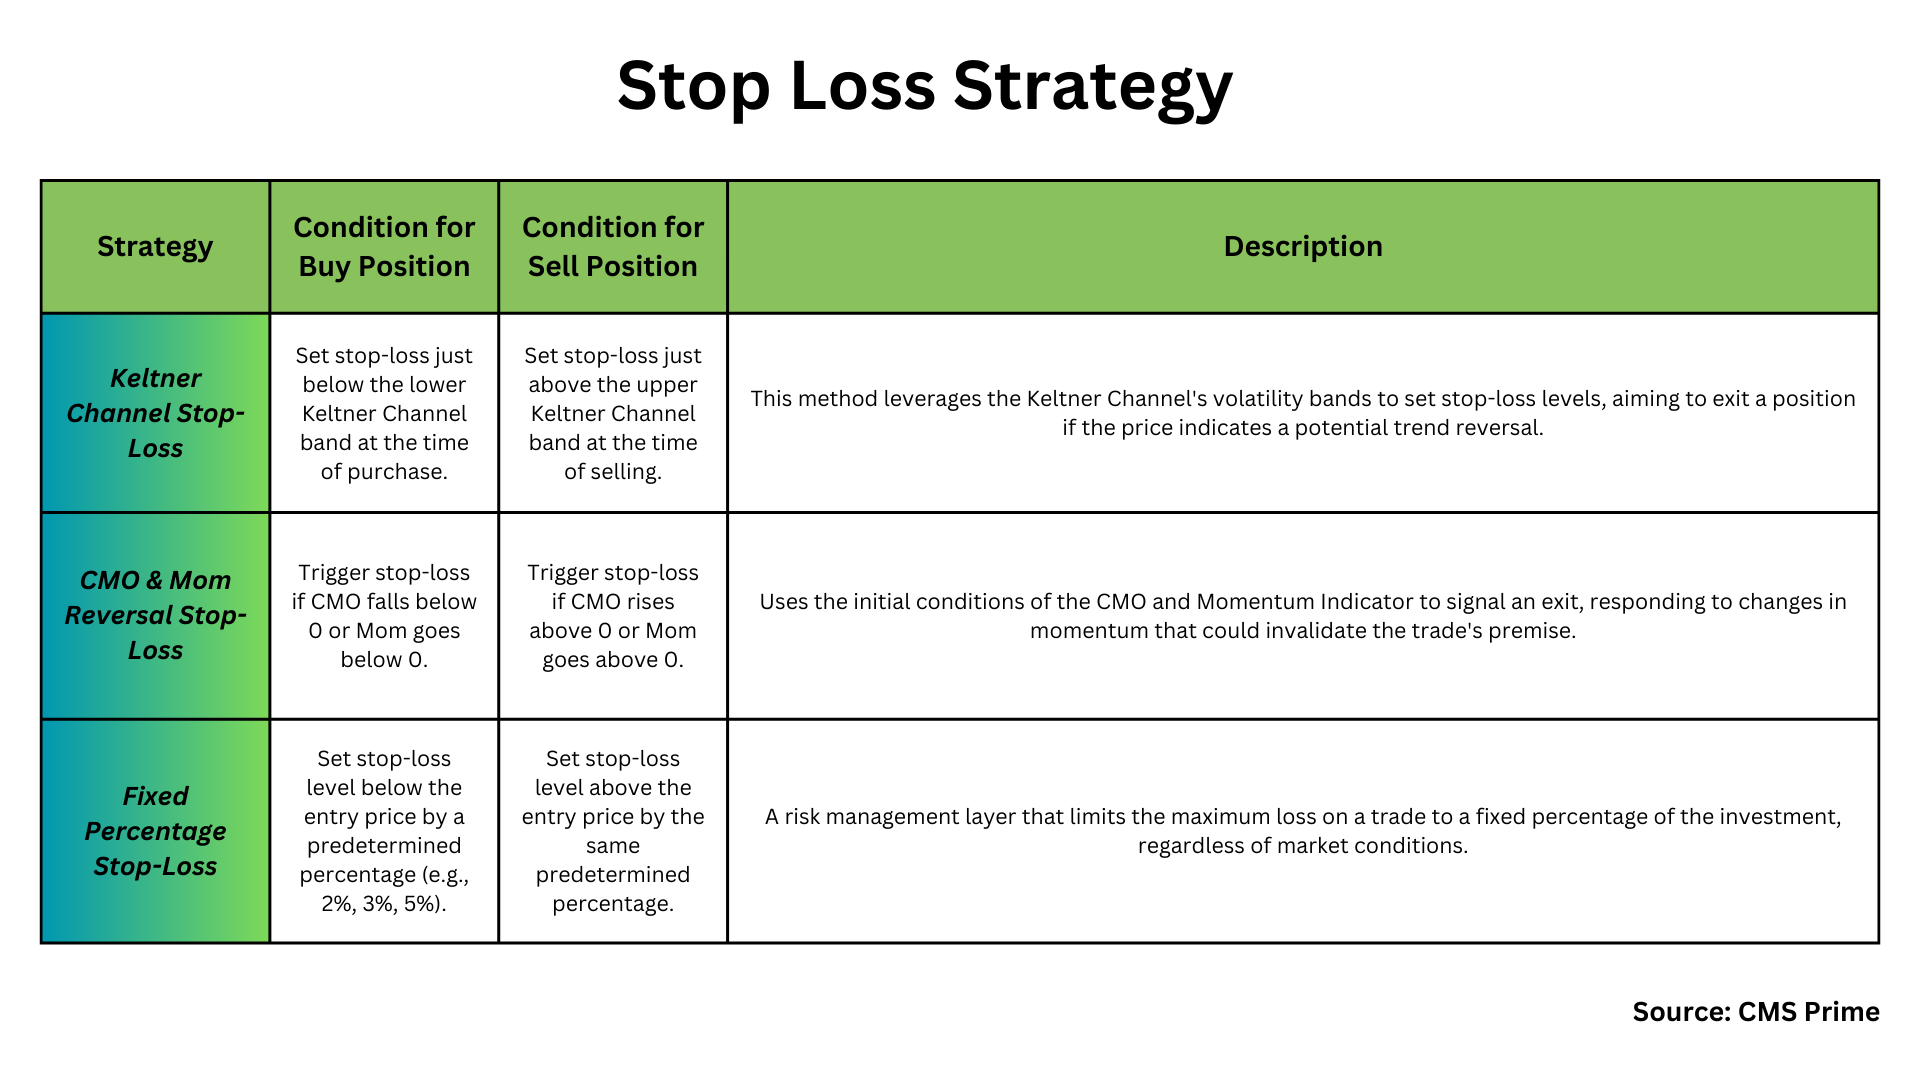
1. Stop Loss Strategies Based on Indicators
Approach 1: Using Keltner Channel for Stop Loss
For Buying: Place the stop loss slightly under the lower band of the Keltner Channel when making a purchase. This method assumes that as long as the price stays above the middle band (and meets the criteria for a buying signal), the trend is positive. If the price drops below the lower band, it could indicate a shift in trend or significant market volatility, justifying an exit.
For Selling: Reverse the buying strategy by setting the stop loss slightly above the upper band of the Keltner Channel when initiating a selling position. A move beyond the upper band might suggest a bullish turnaround, leading to potential losses in a short position.
Approach 2: Utilizing CMO & Momentum Indicator for Reversal Stop Loss
When Buying: The stop loss activates if either CMO falls below 0 or Momentum Indicator dips below 0, indicating a decline in bullish momentum. This approach aligns stop loss tactics with initial trade entry conditions, ensuring exits are executed if those conditions no longer hold true.
When selling: the stop loss will trigger if the CMO exceeds 0 or the Momentum Indicator goes beyond 0, indicating a potential return to positive momentum and possibly challenging the basis of the short position.
Apart from using indicators, setting a fixed percentage stop loss offers a simple risk management approach. This method involves determining the stop loss level as a fixed percentage away from the entry price.
Fixed Percentage Approach: Select a percentage (e.g., 2%, 3% or 5%) that matches your risk tolerance. For buying, place the stop loss level below the entry price by that chosen percentage. For selling, position the stop loss level above the entry price by that same percentage. This ensures that any trade’s maximum loss stays within a set portion of your investment, creating an uncomplicated yet efficient risk management layer.
It’s crucial to keep in mind that stop loss tactics don’t assure protection from losses but serve as aids in risk control. Factors like market fluctuations, such as gaps or slippage, could hinder the stop loss order from triggering at the anticipated price point.