For the strategy, which involves price movements relative to an upper and lower envelope channel, and momentum as indicated by the Chaikin Oscillator, performance can be influenced by several factors, including market volatility, trend strength, and the asset’s characteristic behaviors.
The Strategy:
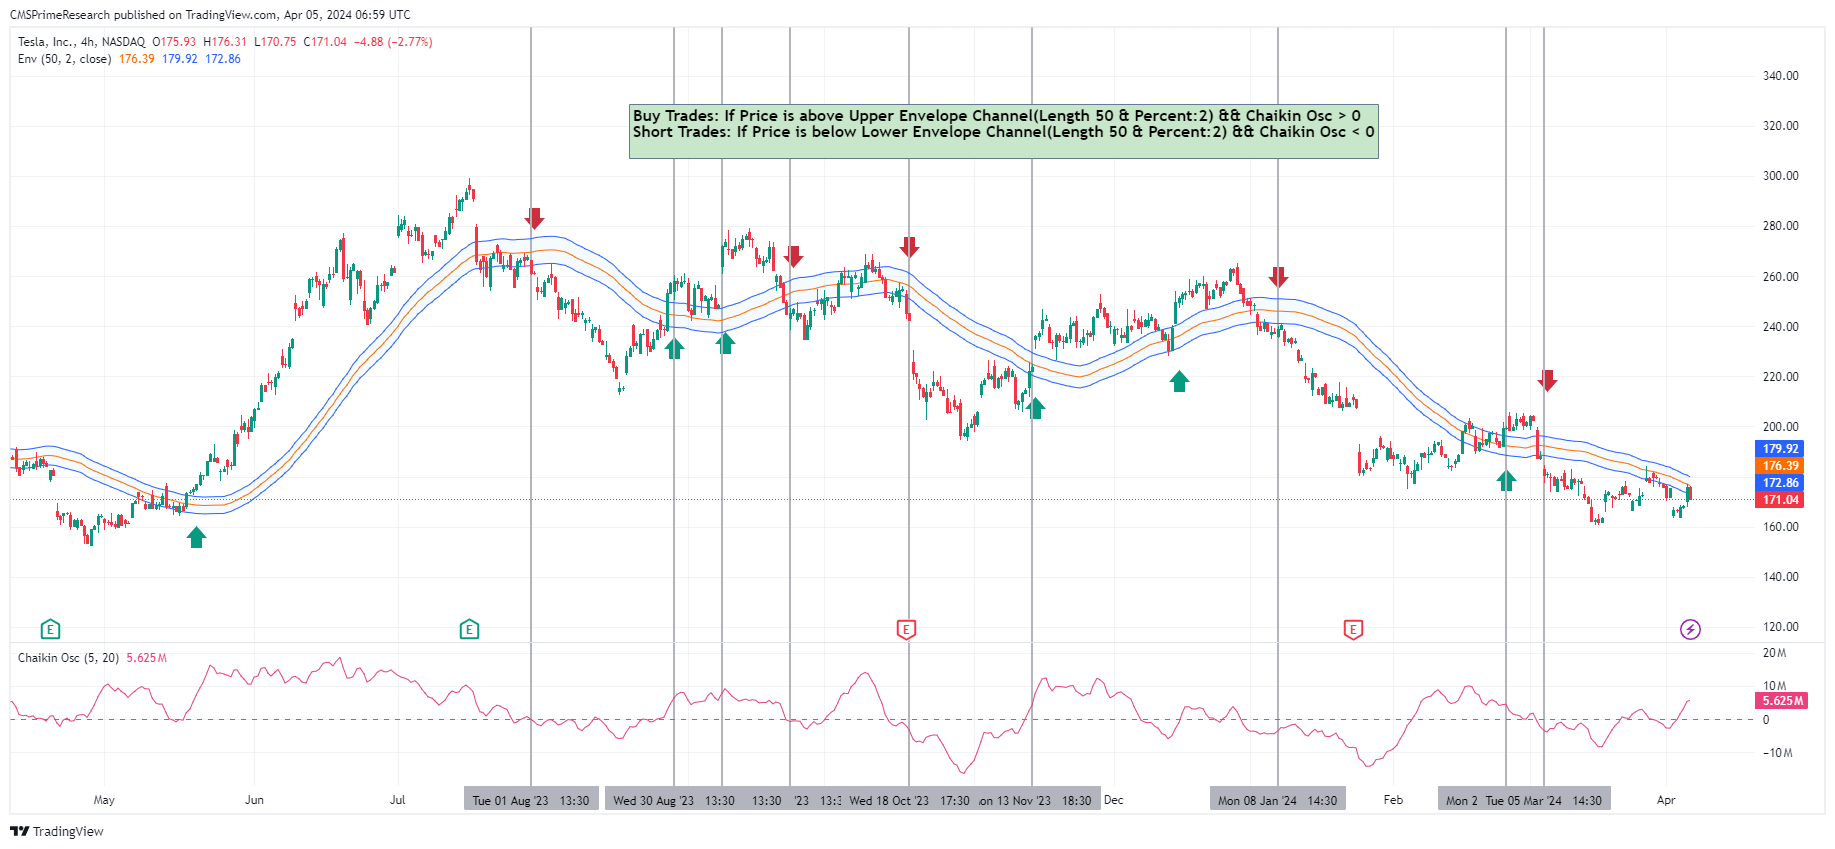
Trend Reversals and Momentum: The chart shows when the stock price touches or crosses the boundaries of the Envelope Channel. Each crossing could indicate overbought or oversold conditions especially when paired with the Chaikin Oscillator crossing zero. This might signal momentum shifts towards either an bearish trend reversal.
Volatility: The width of the envelope channels appears to respond to volatility levels. Wider bands may suggest volatility while narrower bands could indicate less volatile periods. The chart illustrates varying volatility periods where prices move between the lower bands reflecting changes in investor sentiment and market dynamics.
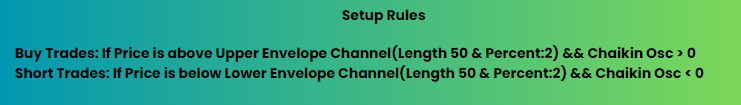
Bullish and Bearish Sentiments: Upward green arrows could signal buying opportunities when prices rise above the upper envelope band alongside a positive Chaikin Oscillator reading. Conversely downward red arrows might indicate selling signals as prices dip below the lower band with a negative Oscillator reading below zero. These signals align with shifts in sentiment showcasing traders’ reactions, to price extremes.
Price Corrections: After receiving bearish signals we often witness price corrections as stock prices realign within the envelope channels. These corrections may signify a neutralizing sentiment as the market adjusts to movements and seeks balance.
Different Phases in the Market: You can see changes between times, when the market is following a trend and when its moving within a range. In trending periods the price regularly touches the bands while in range bound times it moves back and forth inside the bands. This reflects how the market goes through cycles shifting between movements and consolidation phases.
Positives: This is when there are periods where prices stay above the moving average and frequently touch the upper band of the envelope.
Negatives: On the side this happens during extended periods when prices remain below the moving average and often interact with the lower band of the envelope.
Neutral: This occurs when prices move within the envelope bands without showing any direction bias. It implies uncertainty or balance in market sentiments.
Strength of Signals and Their Reliability: The number of signals where prices cross over envelope lines can affect how these signals are interpreted by traders. A single signal may be viewed with caution. Multiple signals confirming each other could reinforce assumptions, about market sentiments.
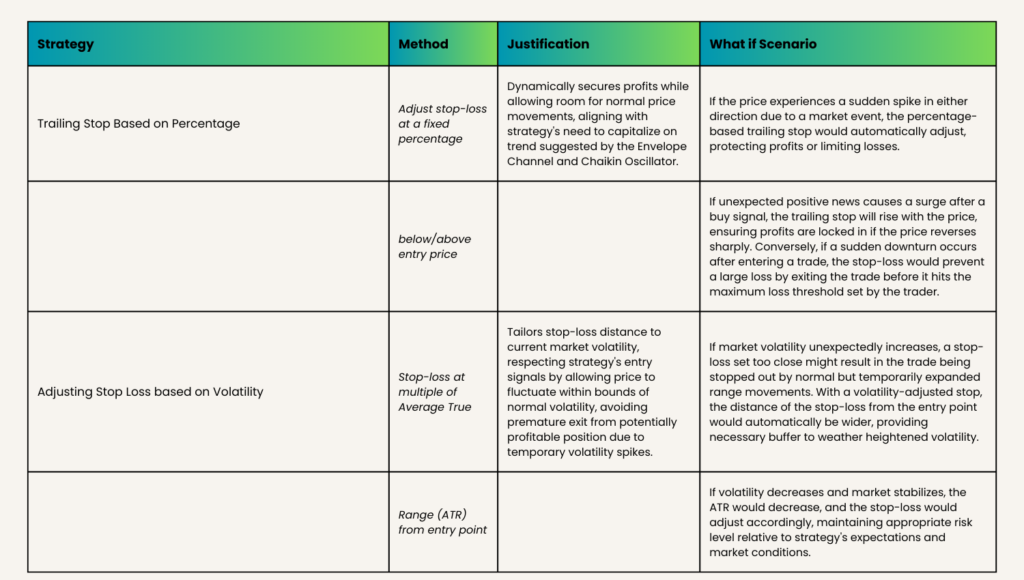
Trailing Stop Based on Percentage Adjustments:
The trailing stop loss is a dynamic method where the stop-loss price is adjusted as the price fluctuates. This can incorporate the conditions of your strategy by setting the stop-loss at a fixed percentage below the price level at which the trade is initiated during a buy signal, according to the Upper Envelope Channel. For a short trade initiated at a sell signal below the Lower Envelope Channel, the stop could be set at a percentage above the entry price. This method ensures that the stop-loss level benefits from favorable price moves and protects capital during unfavorable movements, without being stopped out prematurely from normal price volatility.
Justification:This method is justifiable because it dynamically secures profits while allowing room for normal price movements, addressing the strategy’s need to capitalize on the trend suggested by the Envelope Channel and Chaikin Oscillator.
What if Scenario:What if the price experiences a sudden spike in either direction due to a market event? In such a case, a percentage-based trailing stop would automatically adjust, protecting a portion of the unrealized profits or limiting the loss. For example, if a buy signal is executed and the stock surges due to unexpected positive news, the trailing stop will rise with the price, ensuring profits are locked in if the price reversely sharply. Conversely, if there is a sudden downturn after entering a trade, the stop-loss would prevent a large loss by exiting the trade before it hits the maximum loss threshold set by the trader.
Adjusting Stop Loss based on Volatility:
This strategy involves adapting the stop loss level in line with the markets volatility. By using the Average True Range (ATR) of the asset you can place the stop loss at a multiple of the ATR from the entry point. For example in a buy trade you could set the stop loss at ‘entry price. ( × ATR)’ while in a short trade it might be ‘entry price + (multiplier × ATR)’. The stop loss levels change as per fluctuations in ATR. This approach considers both risk tolerance and current market conditions providing safety margins during high volatility and tighter stops, during periods of low volatility.
Justification: This method makes sense as it tailors the stop-loss distance to current market volatility, which can change rapidly. A volatility-adjusted stop-loss respects the strategy’s entry signals by allowing the price to fluctuate within the bounds of normal volatility, avoiding an exit from a potentially profitable position due to temporary volatility spikes.
What if Scenario: Consider a situation where market volatility unexpectedly increases, perhaps due to a geopolitical event or economic report. If a trade is already in place, a stop-loss set too close might result in the trade being stopped out by normal but temporarily expanded range movements. With a volatility-adjusted stop, the distance of the stop-loss from the entry point would automatically be wider in such conditions, providing the necessary buffer to weather the storm of heightened volatility. If the volatility then decreases and the market stabilizes, the ATR would decrease, and the stop-loss would adjust accordingly, maintaining an appropriate risk level relative to the strategy’s expectations and market conditions.