- GBP/USD climbed but failed to close above 200-day SMA
- Watch for breakout above 1.0620 resistance
- Support at 1.2515 to 1.2500 range
- Bulls aim to keep prices above support to prevent selling pressure
- Potential downside towards 1.2430 if support breached
- Further decline could target 1.2300 handle
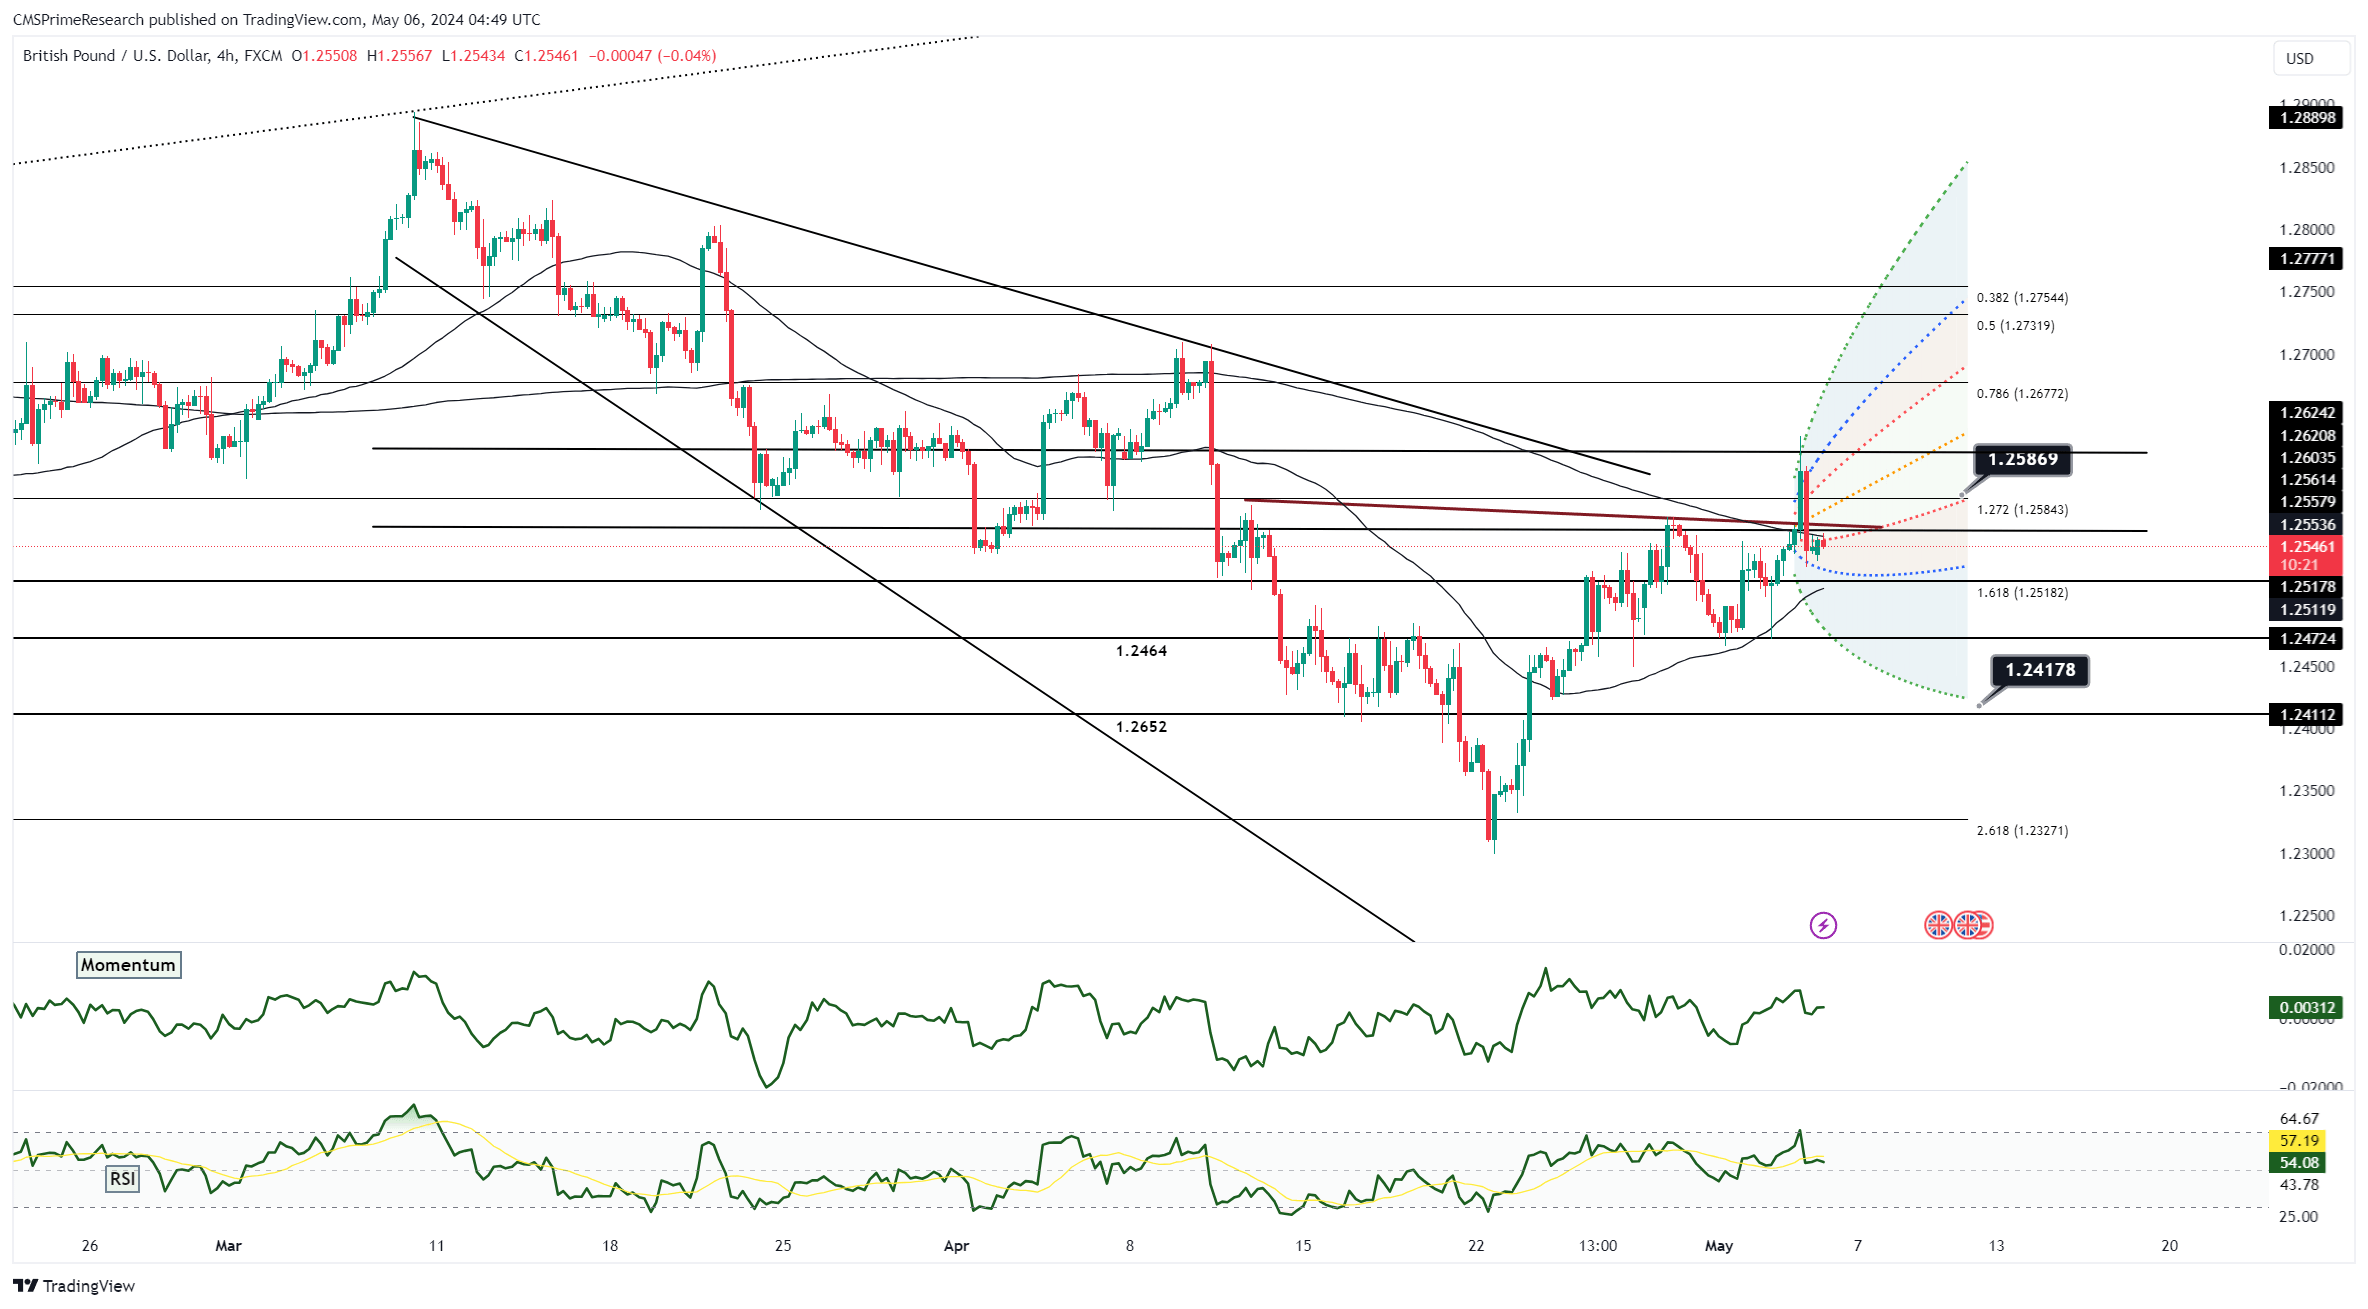
The recent upward movement of GBP/USD lacked momentum, as evidenced by the failure to close above the 200-day simple moving average (SMA). Traders are advised to closely monitor this indicator in the days ahead, as a decisive breakout could signal a retest of confluence resistance around the 1.0620 mark. Conversely, a resurgence of selling pressure could drive cable lower, with immediate support seen between 1.2515 and 1.2500. Bulls seek to maintain prices above this range to mitigate the risk of further declines towards 1.2430, beyond which the 1.2300 handle becomes a potential target. These price dynamics are influenced by both technical factors, such as SMA resistance and support levels, as well as broader market sentiment and macroeconomic trends impacting the GBP/USD exchange rate.