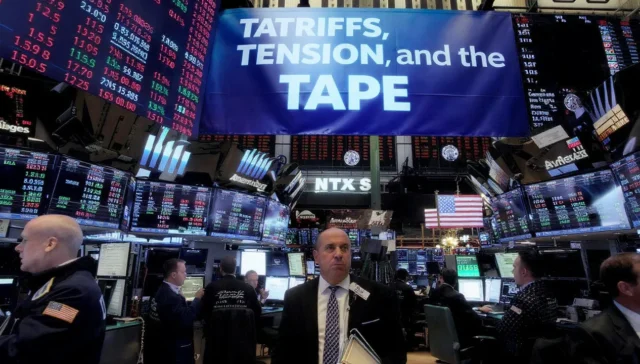
The quick take U.S. stocks suffered their sharpest one-day fall since April as a revived U.S.–China tariff escalation punctured weeks of low realized volatility and…
Lead Bitcoin is hovering near its all-time high as of 9 October 2025, not because of a meme-fueled sprint but because the market’s pipes—the creation/redemption…
Prelude: confidence priced, uncertainty revealedMarkets today behave as though the Fed has already handed them a 25 basis point cut for October — the odds…
A fragile services print meets a foggy data horizon The U.S. services engine coughed right at the line between expansion and contraction: ISM’s September Services…
The setup: breadth by design, not by accident Across the GCC, policymakers did not wait for “market breadth” to serendipitously appear—they engineered it. Saudi Arabia’s…
Gold cresting above $3,800/oz is not a single story; it’s three stories braided together: a real-rate repricing, a reserve-management regime shift, and a reflexive chase…
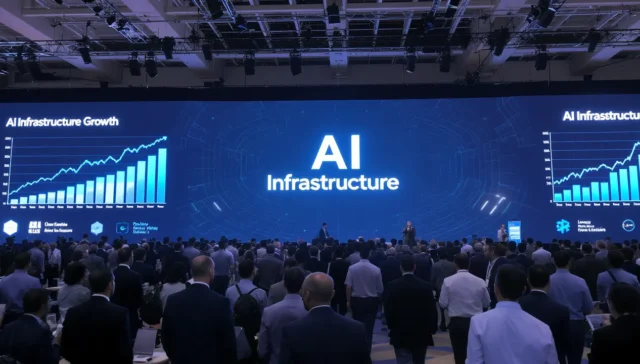
Introduction: Why This Sector May Outperform Soon We are entering a phase where artificial intelligence (AI) is not just a niche or hype storyline, but…
Executive Framing Oracle’s reported multi-year agreement to supply OpenAI with roughly $300 billion of cloud compute starting later this decade is more than a big…
Introduction: Why Market Breadth Matters The S&P 500 is the world’s most watched stock index, a barometer of U.S. corporate health and global investor confidence.…
1. The AI Infrastructure Gold Rush Capital expenditures on AI infrastructure—data centers, chips, cloud systems—from tech giants like Alphabet, Amazon, Meta, Microsoft, are soaring. Goldman…
Navigating Risk in Portfolio Allocation Models – The Challenge of Tech Stock Volatility Introduction Risk management is the compass of modern investing. Without it, even…
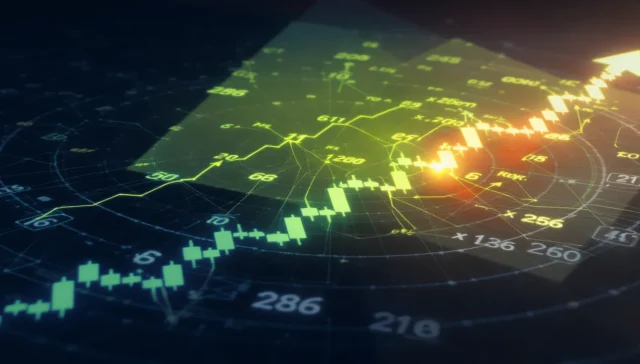
Mastering Chart Patterns for Tech Stock Trading Success Introduction Tech stocks have a reputation for volatility, explosive growth, and sudden reversals. For traders, this presents…
Market Trends and the Art of ETF Valuation – A Comprehensive Guide Introduction Exchange-Traded Funds (ETFs) have become a cornerstone of modern portfolio construction. Their…
Weekly Wrapup: Fed Tensions, Jackson Hole Anticipation, and Global Risk Repricing — 18–22 August 2025 1. Big Picture — Policy Intrigue and Market Crosscurrents The…
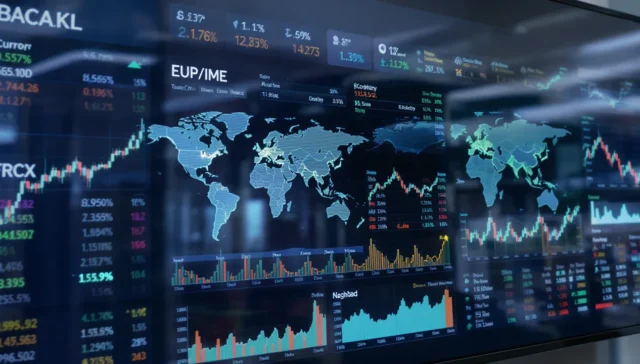
Global Market Currents—From Record Highs to Emerging Risks Introduction: A Market of Contradictions The global stock market today is a paradoxical creature. Indices are climbing…