Based on the current market scenario, gold prices have surged to a six-month high, reaching approximately $2,050 early Wednesday. This upward trend in gold prices is partly due to a weakened U.S. Dollar and declining U.S. Treasury bond yields, influenced by recent dovish statements from Federal Reserve officials.
The U.S. Dollar has hit a three-month low, marked by the U.S. Dollar Index dropping to 102.47. Comments from Fed Governor Christopher Waller, who indicated a shift in policy if inflation continues to decline, have reinforced these expectations. The market now anticipates approximately 25 basis points in rate cuts in the first quarter of next year , a significant increase from previous estimates.
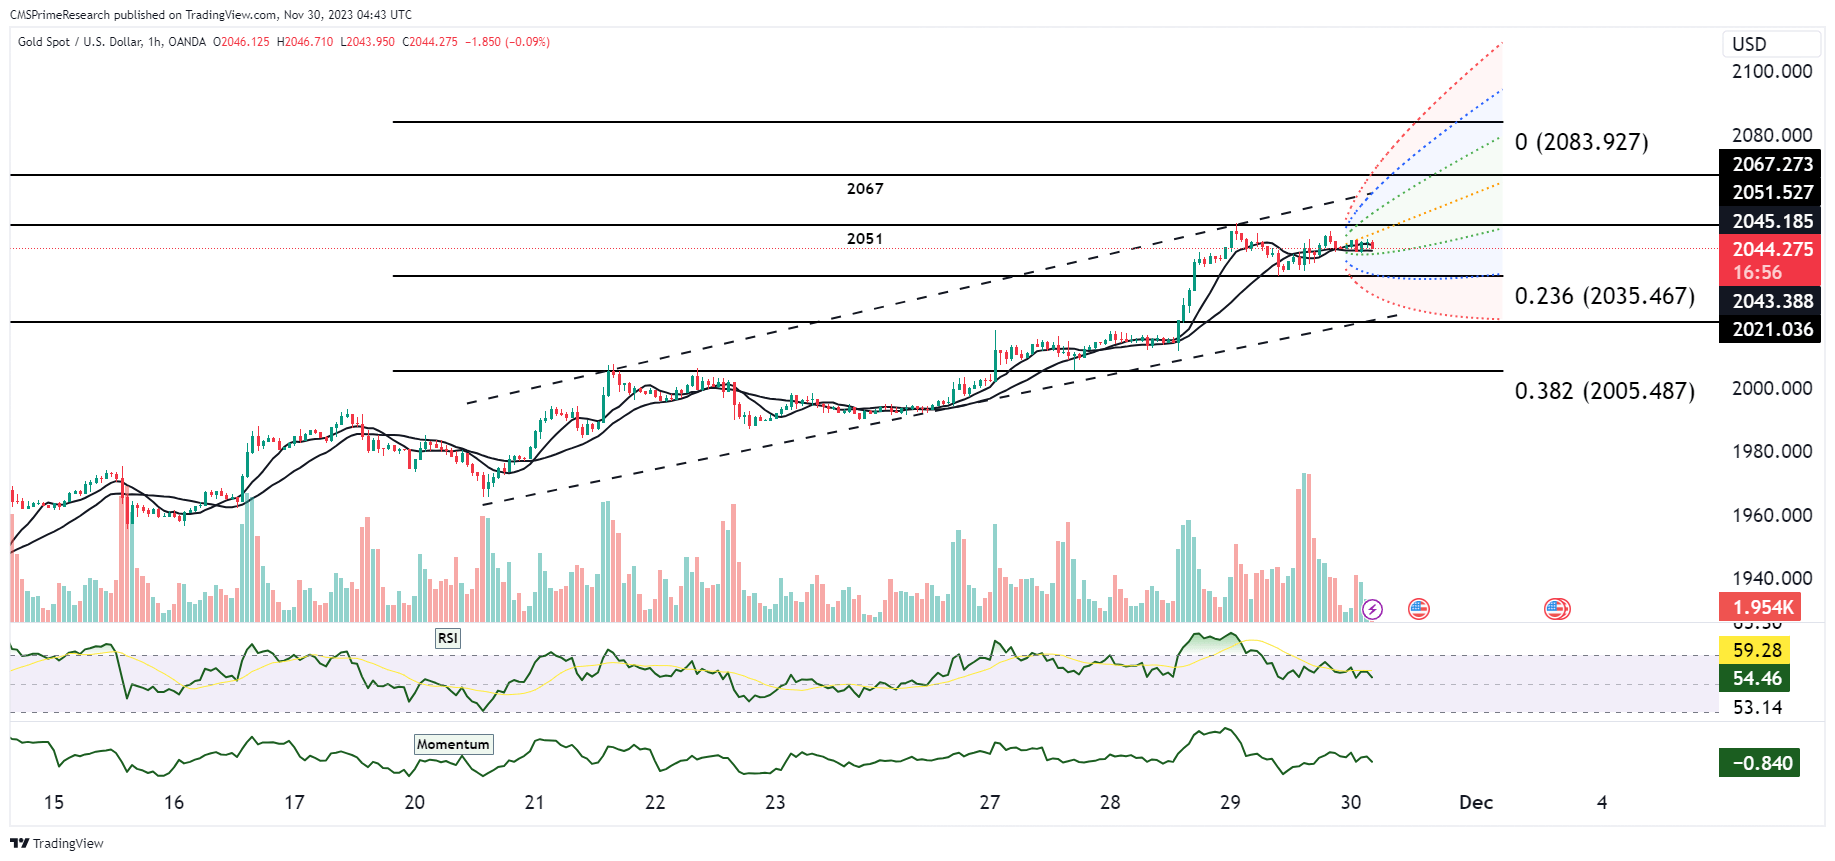
From a technical analysis perspective, the daily chart of gold prices shows a potential for further increases. However, the 14-day Relative Strength Index (RSI) suggests the asset is declining, indicating a possible pullback before continuing its upward trajectory. Key support levels are identified around $2,025 and $2,036, with the $2,000 mark serving as a significant threshold. Additionally, the 200-day Simple Moving Average (SMA) at $1,978 could act as a defense line for buyers.
Moreover, a Golden Cross formation is on the horizon, indicated by the 50-day SMA poised to cross above the 200-day SMA. This technical event may provide a cushion against significant downturns. If the gold price sustains its momentum and breaks above the recent high of $2,053, it could aim for higher resistance levels at $2,063 and potentially test its all-time high near the $2,080 range level.
In summary, gold prices are experiencing a notable upswing driven by a combination of dovish Federal Reserve signals and technical indicators. Despite the potential for short-term corrections, the overall outlook remains bullish, with key technical levels and patterns suggesting continued upward movement.