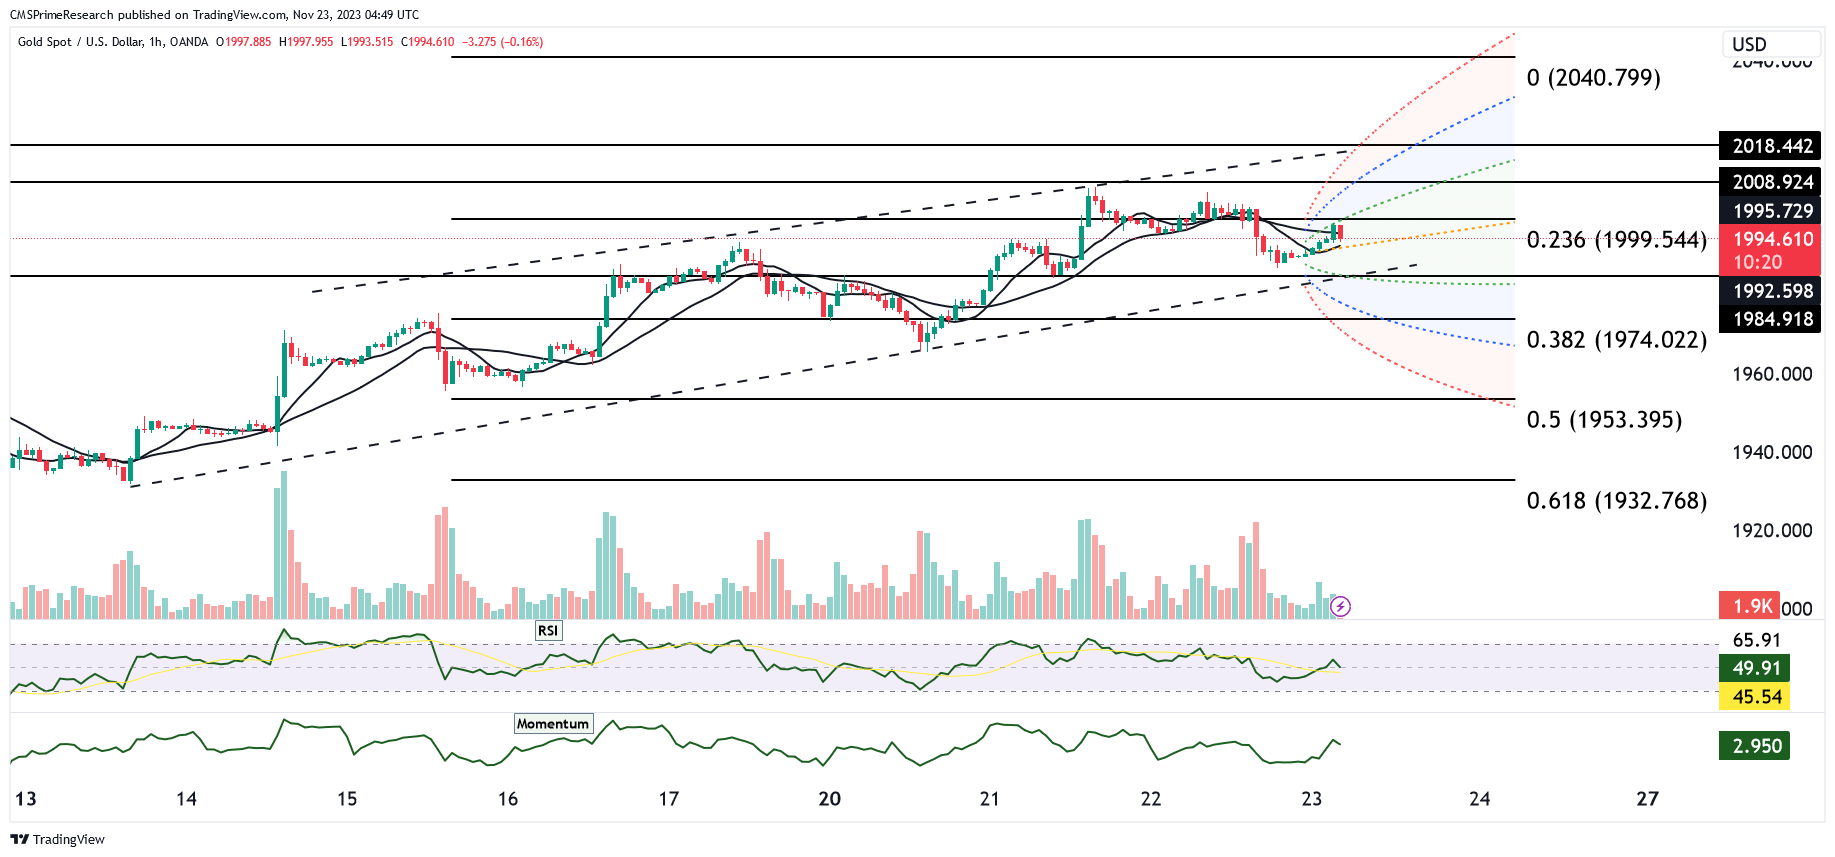
Gold's Bullish Potential Awaits Break Above $2,010 as Technical Indicators Diverge

The daily chart of XAU/USD indicates the potential for a bullish trend, contingent on a break above the $2,010 level. Currently, momentum remains above midlines, with the price situated above key Simple Moving Averages (SMA). Additionally, the Relative Strength Index (RSI) is on an upward trajectory and is far from overbought levels.
However, on the 4-hour chart, XAU/USD maintains its position above an upward trendline, but technical indicators have started to exhibit bearish signals. The RSI is retreating from levels above 70, and the MACD is also signaling bearish tendencies. Presently, Gold has found support at the 20-SMA at $1,988, but a drop below this level could increase downward pressure, potentially exposing the $1,980 area and a short-term upward trendline, which needs to hold to prevent a more significant deterioration in the outlook. A potential recovery to $1,995 may pave the way for another attempt to breach the $2,010 level.
In recent trading, Gold prices faced some headwinds as the US Dollar strengthened, alongside higher Treasury yields. The University of Michigan Consumer Sentiment Index, reporting a rise to 61.3 in November, further contributed to the USD’s resurgence. The US Treasury yields increased, particularly the 10-year yields, which climbed to 4.40%. This development weighed on Gold as higher US yields represent an opportunity cost for holding non-yielding assets like precious metals.
Moreover, Gold markets have remained subdued due to the upcoming Thanksgiving Day holiday in the United States, limiting trading activity. Gold’s current trading level hovers around $1,990, indicating a minimal 0.02% gain for the day.
Gold traders are keeping an eye on upcoming data, particularly the US S&P Global PMI figures expected on Friday, for fresh insights into market direction. The Manufacturing PMI is anticipated to rise to 49.8, while the Services PMI is projected to grow to 50.4. These data points have the potential to provide clarity on Gold’s future price movements.
Key Levels to Watch: : 2001,1977,1982,1966,1997
| Levels | Support | Resistance |
|---|---|---|
| Level 1 | 1987.50 | 1999.50 |
| Level 2 | 1983.50 | 2003.50 |
| Level 3 | 1977.50 | 2009.50 |


