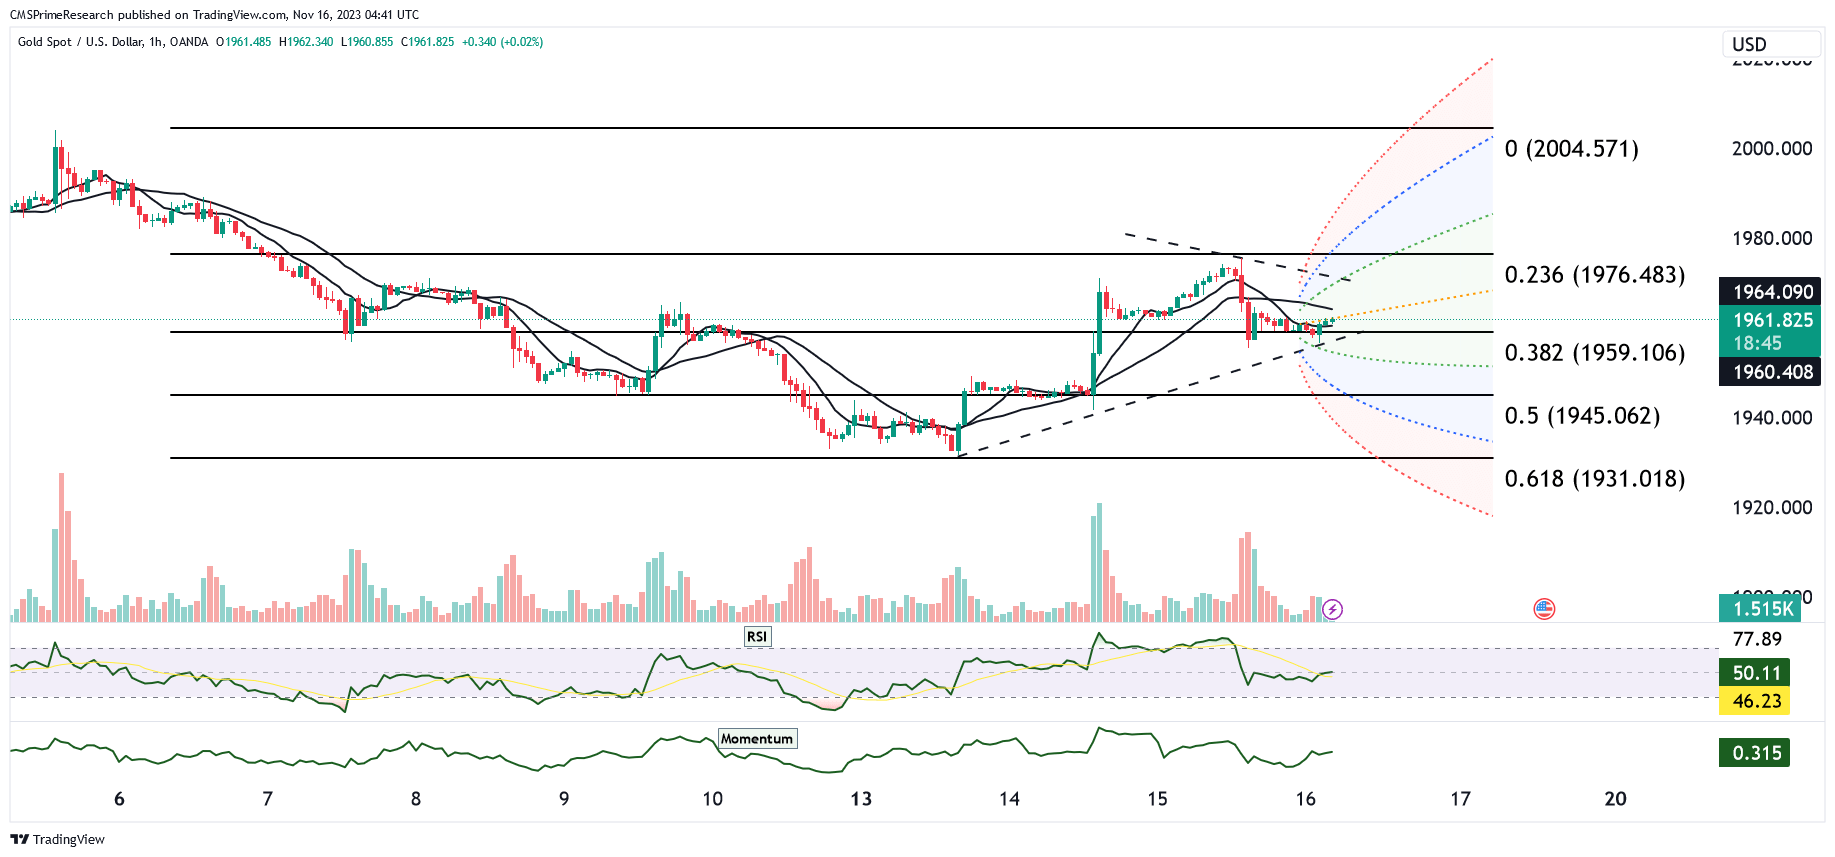
A recent market analysis spanning from the 6th to the 14th of a particular month reveals a notable shift from a bearish to a bullish trend in the gold market. Initially, the market exhibited a bearish phase characterized by lower lows and highs, with prices consistently below the moving averages. However, from the 10th onwards, a clear reversal in this trend became evident, signaling bullish momentum. During this phase, higher highs and higher lows emerged, with prices surging above the moving averages.
Incorporating Fibonacci retracement levels based on this peak, potential support levels are identified at 1976.483 (0.236), 1959.106 (0.382), 1945.062 (0.5), and 1931.018 (0.618). The current price hovers just below the 0.236 Fibonacci retracement level, suggesting a critical juncture in the market’s trend. Examining key market indicators, the Relative Strength Index (RSI) maintains a position slightly above 50, indicating a neutral to bullish sentiment. However, the Momentum indicator, although above zero, shows signs of decreasing from its peak, hinting at a potential loss in bullish momentum. Trading volume has remained relatively stable, without significant fluctuations.
The overall market sentiment appears indecisive, particularly as the price action nears the 0.236 Fibonacci retracement level, potentially forming a resistance zone. The market’s reaction at this level will be pivotal, potentially leading to either a short-term bearish reversal or consolidation if the price fails to sustain above it. Conversely, a rebound above this level could signal the continuation of the bullish trend. To assess the strength of the prevailing trend, close monitoring of the RSI and Momentum indicators is crucial in the upcoming periods.
Additionally, gold prices have remained relatively stable, with spot gold trading at $1,963.07 per ounce. Factors contributing to this stability include expectations that the Federal Reserve’s tightening cycle has concluded and a rebound in the U.S. dollar, which has somewhat limited gold’s gains. The recent robust U.S. economic data has further strengthened the U.S. dollar, making gold relatively more expensive for overseas buyers. Signs of slowing inflation have led investors to anticipate that the Fed may halt rate hikes, with expectations shifting towards potential rate cuts. These lower interest rates tend to enhance gold’s appeal as a hedge against inflation. However, increasing conviction regarding the idea of “higher-for-longer” rates has somewhat dimmed gold’s short-term investment appeal, even though long-term drivers for gold remain intact. Overall, the market remains cautious, with a focus on the evolving Fed expectations and economic data for further insights into gold’s future direction.