
Gold prices have embarked on a notable recovery, springing from a seven-month low of $1,810 to crest fresh biweekly highs amidst Thursday’s European trading session. The escalating geopolitical turmoil in the Middle East has reinvigorated gold’s esteemed safe-haven allure, further bolstered by a diminishing US Dollar (USD) and a retreating trajectory in global bond yields, thereby uplifting the appeal of the non-yielding asset.
Potential signs of a dilution in US inflationary pressures could cement expectations that the Fed will preserve its current stance in November, while also inflaming predictions of a prospective rate reduction in Q2 2024. This outcome could usher in further USD depreciation and enhance demand for USD-denominated gold. Conversely, robust data could sustain hopes for an additional Fed rate adjustment before year-end, potentially prompting XAU/USD enthusiasts to secure profits, even if any retracement is ephemeral.
Fed Governor Christopher Waller’s Wednesday’s proclamation that elevated market rates may afford policymakers a “watch and see” posture, coupled with September’s US PPI surpassing anticipations, albeit with underlying inflationary pressures in decline, are significant. Concurrently, investors appear persuaded that the Fed’s policy-tightening epoch is concluding and interest rates have culminated. Furthermore, the US Dollar’s retraction from an 11-month zenith is also buttressing XAU/USD.
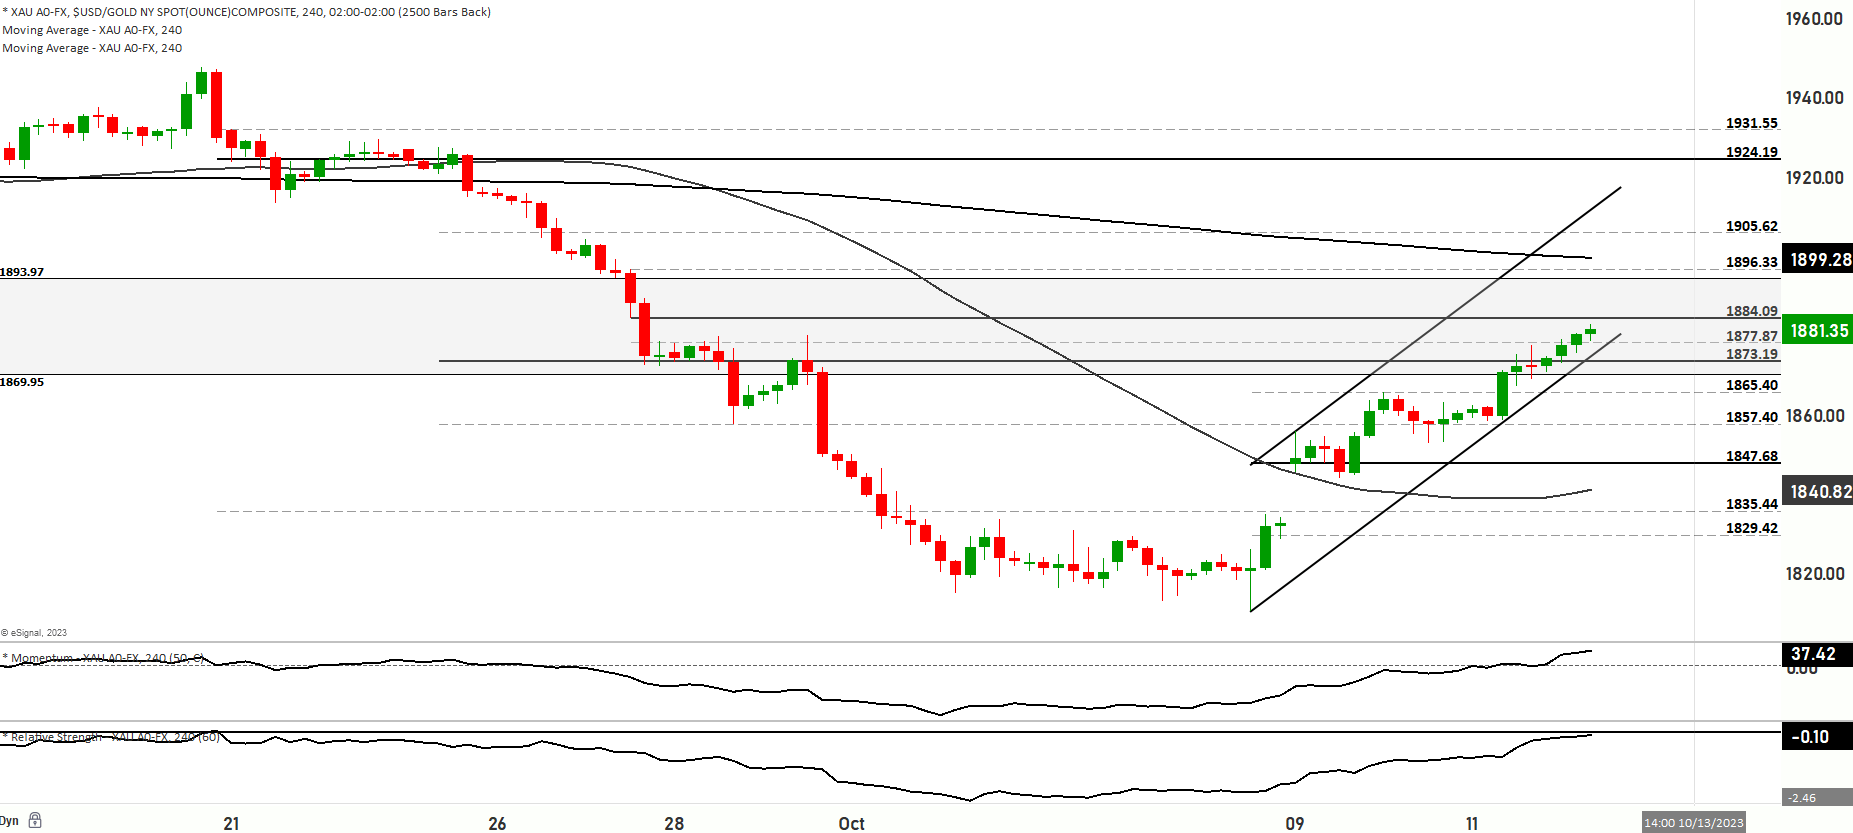
Technical analysis discerns that a sustained advance beyond the $1,865-$1,866 horizontal obstruction could pave the way for additional gains, targeting the $1,885 zone. However, despite recovery from negative zones, daily chart technical indicators have yet to substantiate a bullish stance. Hence, any additional upward impetus is anticipated to encounter robust resistance and may be constrained around the $1,900 psychological level. Nevertheless, if buying persists, it could act as a catalyst for bulls and propel gold prices towards the 200-day SMA, presently situated around the $1,928-$1,930 zone.
Alternatively, the immediate downside may now be shielded by the $1,866-$1,865 resistance-turned-support, preceding the $1,853-$1,850 zone. Consequently, while gold’s price momentarily resides in a bullish zone, veering within the 1877 level, vigilant attention to potential pullbacks towards the 1860 level is warranted.