


For gold, current conditions are shaped by a mixed market sentiment and the stabilization of the Asian bond market. Longer-term US Treasury bond yields have pulled back from multi-year peaks, causing the US Dollar to enter a consolidation phase near 10-month highs against major currencies. The benchmark 10-year US Treasury bond yields are down 4 basis points from recent highs, offering support to gold prices. Initially, the US bond market faced challenges due to concerns about a US government shutdown, but some relief emerged as a US House of Representatives bill cleared procedural hurdles for government funding. Additionally, gold prices find support from record-high premiums in China’s physical bullion market, at times exceeding $100 an ounce over international prices. China’s increased gold imports via Hong Kong in August further contribute to the supportive backdrop.
However, the US Dollar has exhibited strength due to investor worries about rising borrowing costs and their potential impact on global economic growth. Several US Federal Reserve policymakers have voiced support for a “higher for longer” interest rate stance. This strength in the US Dollar presents a headwind for gold, making the precious metal relatively less attractive.
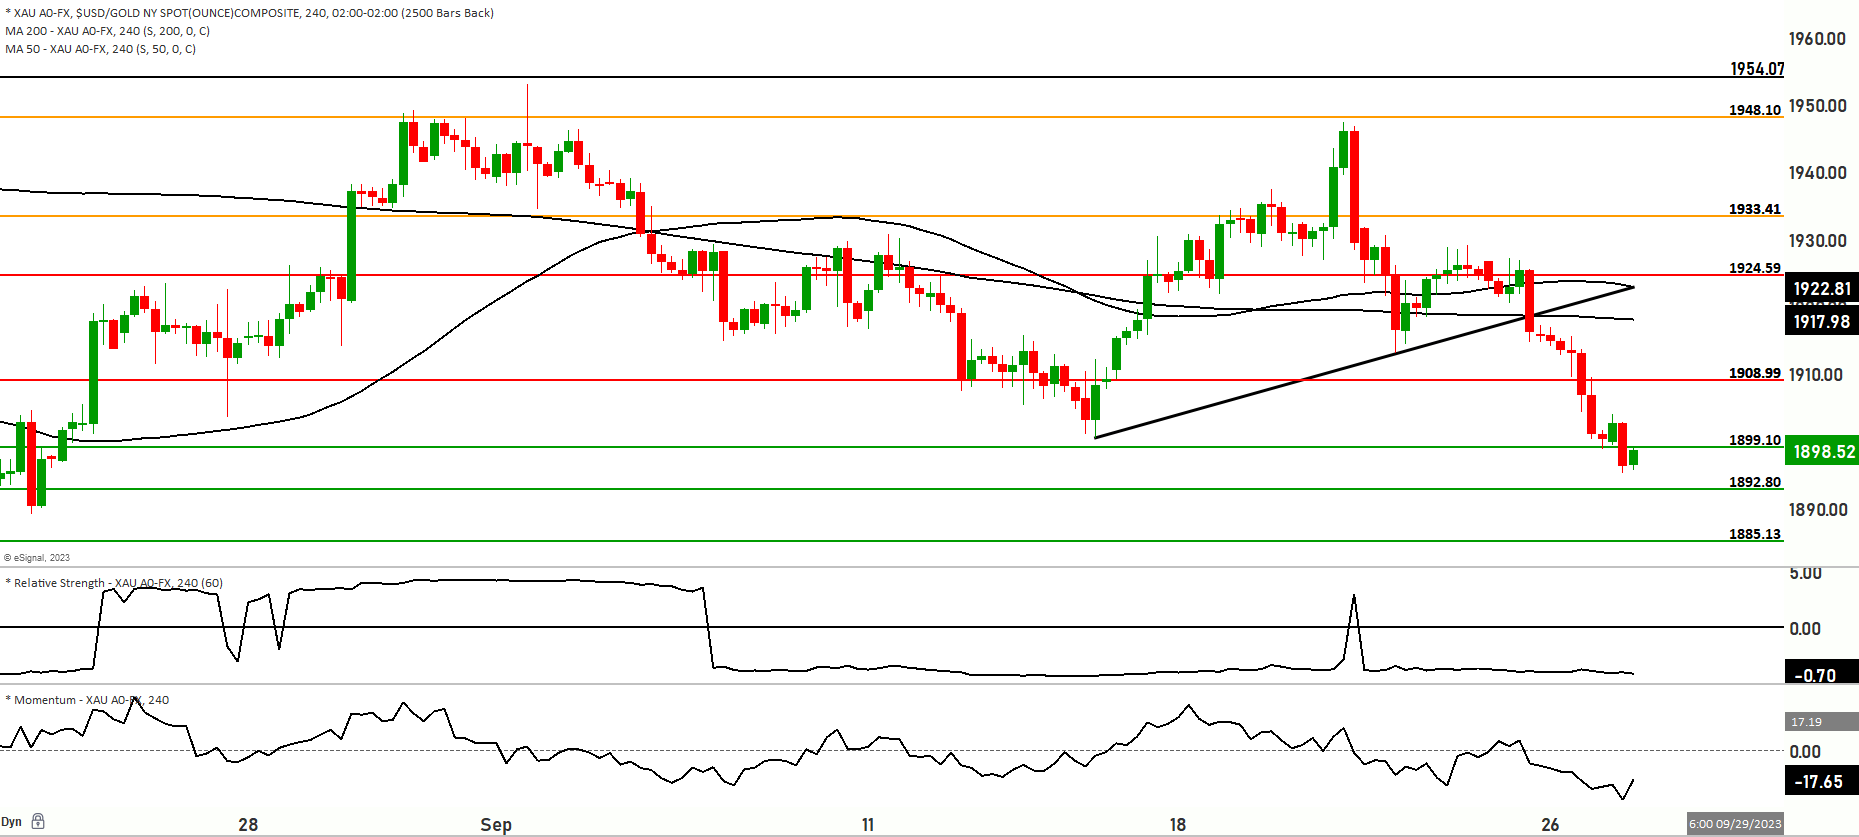
On the technical side, gold is currently experiencing a bearish trend while range trading around the 1897 level. It remains below both the 200-day and 50-day moving averages, signaling bearish sentiment. Support levels to watch include 1892.80, 1885, 1881, and 1875, with the latter being a significant support level. If gold rallies, it could face resistance at 1905, 1908, 1917, and 1921, where 1908 and 1921 are considered major resistance levels. The short-term momentum is bullish but consolidating, indicating uncertainty. Traders should exercise caution as the market might continue to trade within the range of 1875 to 1920 in the near term. To determine future price movements, market participants are closely monitoring US Durable Goods Orders data and Federal Reserve communications. The statements and actions of Fed officials will be crucial in shaping market expectations for gold.