


The recent decision to maintain key interest rates unchanged by the Federal Reserve has introduced important dynamics into the XAU/USD (Gold/US Dollar) market. This decision has the potential to influence the value of the US dollar (USD) and the attractiveness of gold as an investment. The unchanged rates could weaken the USD and make holding gold more appealing, especially considering that gold does not offer a yield like interest-bearing assets. Consequently, lower interest rates or the expectation of prolonged low rates can enhance gold’s appeal to investors as a store of value.
Furthermore, the Federal Reserve’s commitment to achieving its 2% inflation target indicates a willingness to accommodate higher inflation in the short term, which is often interpreted as a dovish stance. This dovish posture by the Fed is supportive of gold prices, as gold is traditionally viewed as a hedge against inflation. If investors anticipate an increase in inflation, they may turn to gold as a means of safeguarding their purchasing power.
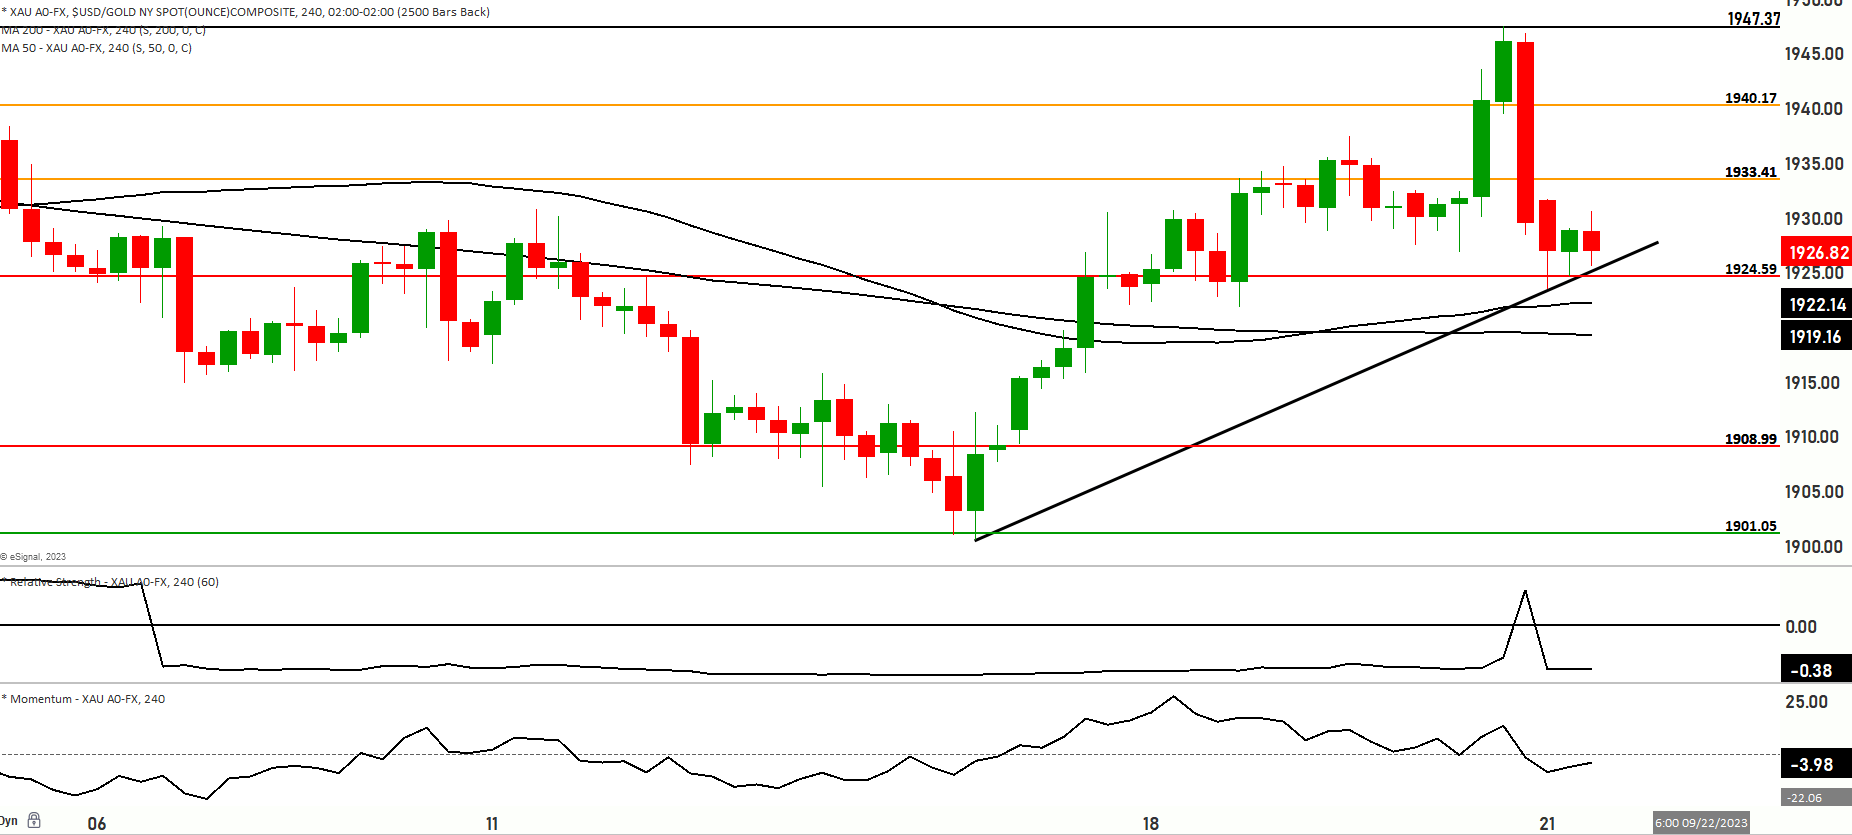
As for the current technical aspects of the XAU/USD pair, it is worth noting that the price of gold is currently in a bearish trend but appears to be range-bound, with the 1928 level serving as a key reference point. Additionally, the price is currently trading above both the 200-day and 50-day moving averages, which suggests a bullish bias and a zone of strength in the market.
The price may decline from its current level and could potentially test support levels at 1924. Further downside momentum might be observed at the 1919 level, and if bearishness persists, the levels of 1917 and 1913 become relevant, with 1911 acting as a major support level.
If the price moves higher from its current level, it may test resistance at 1933 and then challenge the key resistance level at 1940. Beyond this point, further resistance levels to watch for are 1944.50 and 1950, both acting as significant barriers to further upward movement.
Regarding the short-term momentum of the market, it is currently characterized as bullish but consolidating, indicating a degree of uncertainty or equilibrium in the near term..