


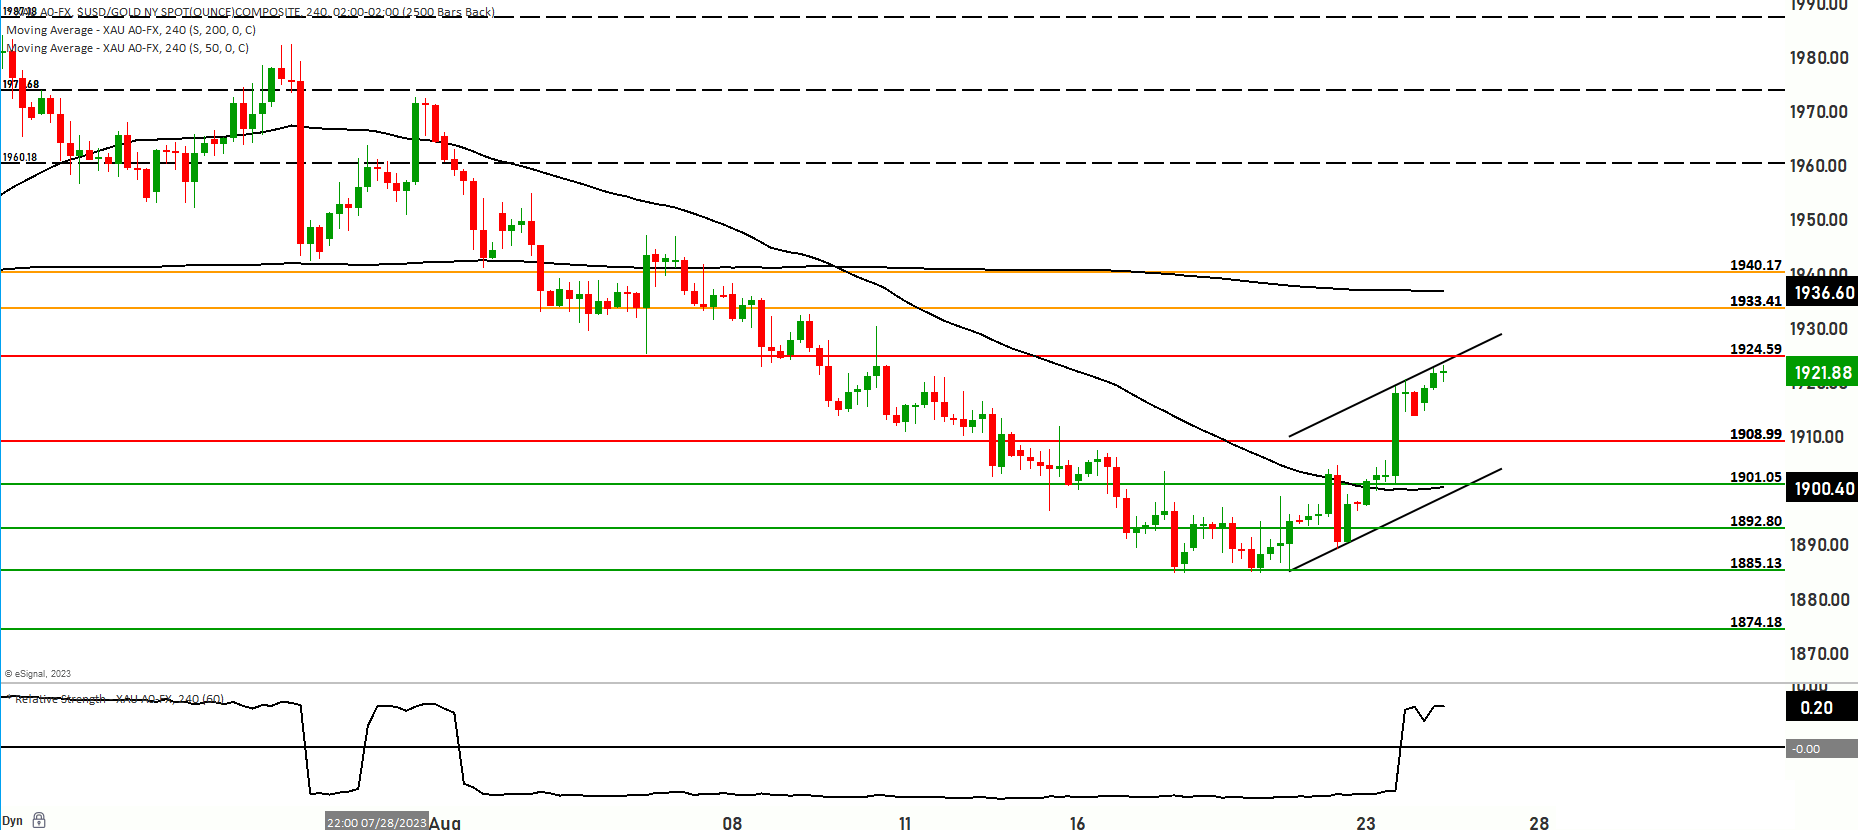

Currently, the price of gold is exhibiting a bullish trend, yet it appears to be range-bound around the 1920 level. This means that despite its overall upward trajectory, it is encountering a period of consolidation where it hovers within a particular price range. Notably, the price of gold is positioned between two significant moving averages: the 200-day and 50-day moving averages. This suggests that while the market sentiment leans towards bullishness, the exact direction is still to be determined. One event to watch are the Jackson Hole Speeches as they possess significant power to influence gold prices, as they provide insights into central banks’ stance on interest rates, inflation, risk sentiment, currency dynamics, and psychological market factors. These pronouncements can lead to shifts in investor sentiment, impacting the attractiveness of gold as a safe-haven asset. The speeches’ potential to signal changes in monetary policy, particularly interest rates, creates fluctuations in yields that can inversely affect gold’s appeal. Furthermore, discussions about inflation and strategies to address it can trigger moves in gold prices, given its role as an inflation hedge.
In the first scenario, there is a possibility that the price might experience a decline from its current level. This decline could lead to a potential testing of the support levels at around 1908. If the downward momentum persists, a further drop to approximately 1901.05 could be observed. In the event that this bearish trend continues, the levels at 1889 and 1885 emerge as critical support points.
On the other hand, in the second scenario, if the price manages to move upwards from its current position, it could encounter resistance at the level of 1924. Successfully surpassing this point could pave the way for testing the primary resistance level at 1933. Should the price manage to breach these resistance levels, the subsequent levels to monitor are 1940 and 1947 or even test the 1960 level.
Traders and investors are advised to exercise caution during this period of market activity. There is a likelihood that the market could continue ranging between the levels of 1874 and 1950 in the upcoming days. The levels of 1950 and 1892 hold particular significance as they might play a pivotal role in determining the market’s future direction. Should the price breach 1950, it could signal a continuation of the bullish trend. Conversely, if the price drops below 1892, it might suggest a resurgence of bearish sentiment in the market.