
USD/JPY appears to be in a holding pattern just below the key psychological level of 150.00, with the Asian session trading in a quiet range between 149.73 and 149.84 . Traders are exercising caution as the weekend approaches, and they are also anticipating the release of US retail sales data next week. The focus remains on higher US yields, which are currently supportive, with 2-year Treasury yields at 5.049% and 10-year yields at 4.677%. Japanese exporters are reportedly offering the USD/JPY pair ahead of the 150.00 level, while importers are looking for opportunities to buy on dips.
In the context of technical analysis, USD/JPY has rallied back toward the 2023 highs at 150.165 following a surge in Treasury yields post-CPI data. The uptrend had already reasserted itself on Thursday. While the CPI data were close to expectations, the overall increase and services component were above forecasts. The gains in USD/JPY have been aided by corrections in overbought USD conditions and reversals in key Treasury yield levels. Both the US Dollar and the Japanese Yen have seen gains amid a retreat in risk sentiment, but the higher-yielding USD has performed better.
The focus for USD/JPY now is whether a breakout above 150.00 can be sustained, especially after the sharp drop on October 3rd. The upper 21-day and 30-day Bollinger Bands are both near the October 3rd peak. The market will be watching next week’s US retail sales data to gauge confidence in a sustained move above 150.00. The spreads between 2-year and 10-year US Treasury yields and their Japanese counterparts remain bullish, although they are below recent highs. The best-case scenario could see a test of the channel top from 2023, around 151.94. However, there is a risk of a major bearish divergence top after clearing 150.00.
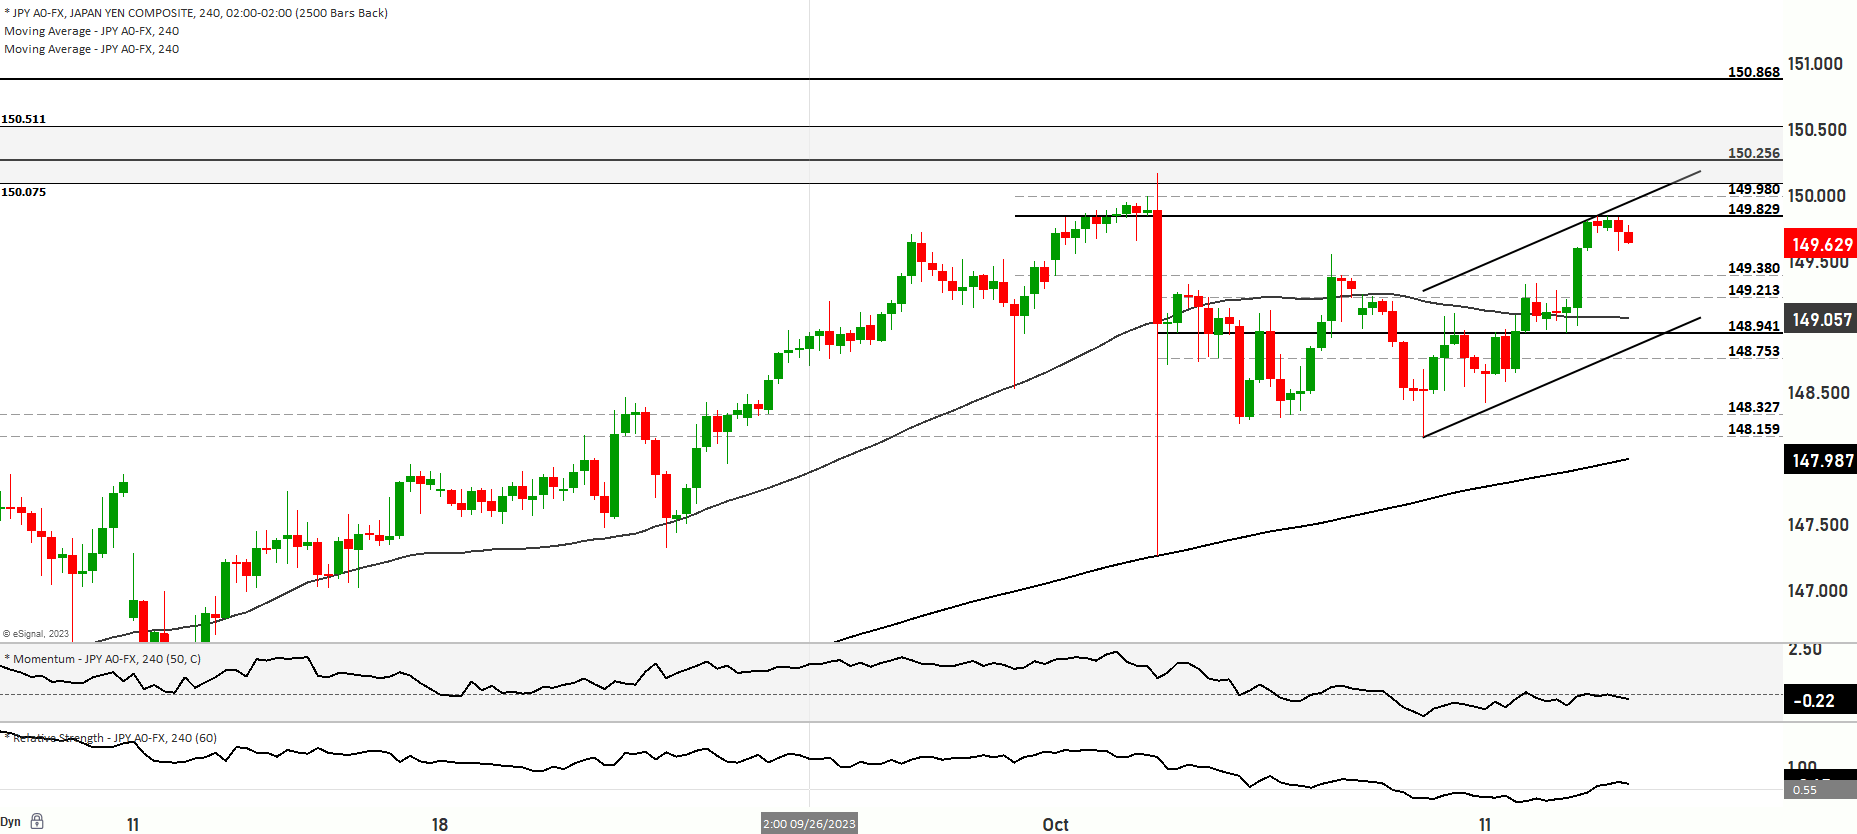
From a technical perspective, USD/JPY is currently trading at 149.580, above both the 50-day and 200-day moving averages, indicating a bullish range momentum. In Scenario 1, the price could continue to rise and retest the 149.824 level, with further bullishness potentially leading to a test of 150.306, the top of resistance level 1, and possibly reaching the 150.764 and 151 levels as major resistance. In Scenario 2, a decline in price could test support levels at 149.363, 148.913, and 148.670. Successful tests could lead to further downside movement toward 148.404, with subsequent support at 148.112 and 147.832. While the market currently exhibits bullish range momentum, the possibility of a pullback from previous highs suggests potential oversold conditions, with the Relative Strength Index (RSI) nearing the oversold region.