
Silver prices experienced a decline of -1.05%, settling at $21.090 per ounce, primarily influenced by a confluence of factors. These pressures included the cautious stance of the Federal Reserve, concerns regarding a potential US government shutdown, and apprehensions about reduced industrial demand stemming from China’s slowing economy. Despite inflation, as measured by the core PCE price index, reaching 3.9% in August (the lowest since September 2021), with the headline rate at 3.5%, silver prices remained near their lowest point since March 10th. This was largely due to the resilience of the US dollar and the rise in Treasury yields, reflecting expectations of an extended period of restrictive monetary policy by the Federal Reserve.
However, the future outlook for silver appears promising, driven by several factors. Notably, there is increasing demand for silver from the solar industry, limited supply growth from mines, and diverse industrial applications, including electronics, electric vehicles, and solar panels. These applications are propelled by the global shift towards green energy. In 2022, the silver market experienced a substantial deficit of 237 million ounces, as reported by the Silver Institute, and these deficits are anticipated to persist in the years ahead.
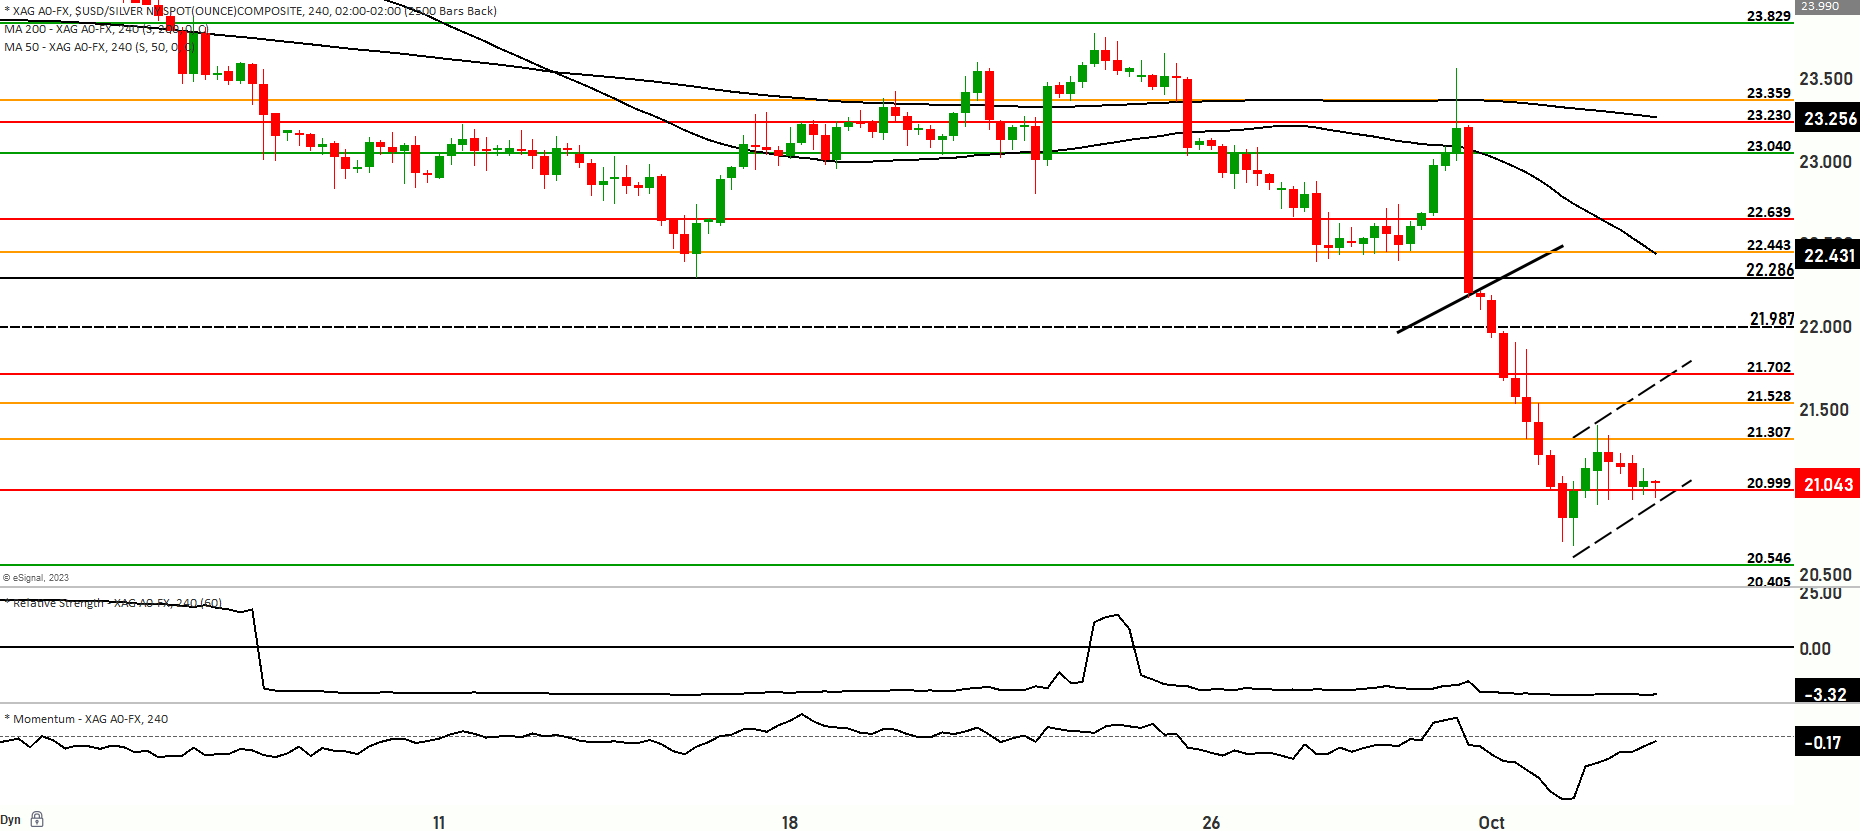
From a technical analysis perspective, the current state of the silver market is characterized by a bearish trend within a range, with prices at the $21.060 level. The market is positioned below both the 50-day and 200-day Moving Averages, indicating a range-bound but somewhat bullish sentiment. In Scenario 1, prices may decline, testing support levels at $20.999 and $20.761, potentially continuing lower to the $20.716 level, with critical support at $20.546 and $20.395. On the other hand, in Scenario 2, prices might move higher from the current level, testing resistance at $21.165, and encountering further resistance at $21.307. Continued upward momentum could lead to a test of the $21.750 and $21.978 levels, serving as significant uppermost resistance. It is essential to exercise caution as the market could range between $20.546 and $21.978 levels, with price reactions at these levels determining its future direction. The market’s current momentum is bullish, with the Relative Strength Index (RSI) in an overbought range.