Current Factors Influencing Current Crude Oil Prices:
- Oil prices increased on Tuesday due to a combination of factors, including a higher global economic growth forecast and escalating tensions in the Middle East.
- March Brent crude futures settled at $82.87 a barrel, while the more active April contract settled at $82.50. U.S. West Texas Intermediate crude settled at $77.82.
- The International Monetary Fund (IMF) upgraded its global economic growth forecast, including the outlook for the U.S. and China, which eased concerns about economic slowdown.
- Concerns about Chinese demand arose earlier due to a real estate crisis, particularly the liquidation of China Evergrande Group.
- Ongoing conflicts in the Middle East also supported oil prices.
- U.S. President Joe Biden considered a response to a drone attack, possibly affecting market sentiment.
- The U.S. began reimposing sanctions on Venezuela, while Saudi Arabia decided to maintain its oil production capacity at 12 million bpd, signaling potential supply stability.
- An upcoming OPEC+ meeting on Feb. 1 may provide insights into future production plans.
- U.S. crude stocks decreased by 2.5 million barrels, but gasoline inventories increased by 600,000 barrels, according to American Petroleum Institute figures, with official U.S. government data awaited on Wednesday.
Technical Analysis

Technical Analysis:
Price Action and Trends:
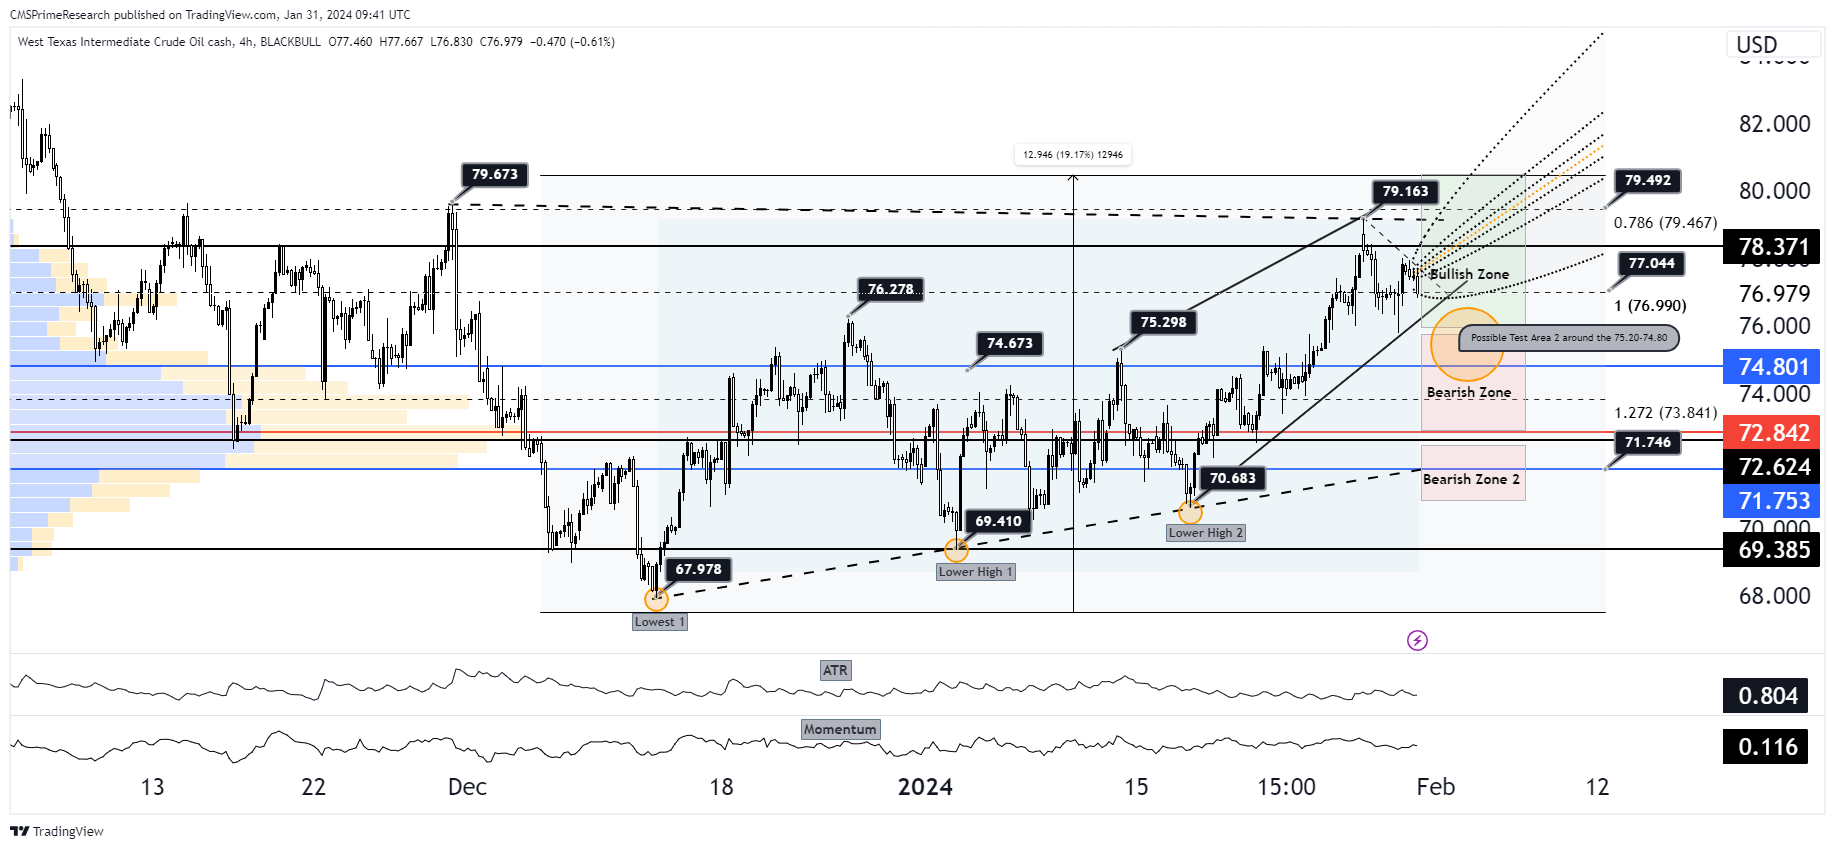
- The chart shows WTI crude oil in an uptrend, characterized by higher highs and higher lows within a rising channel pattern. The price is currently near a potential resistance zone around $79, indicating a recent bullish move.
Support and Resistance Levels:
- The chart identifies several key resistance levels at $79.673 and $79.163, with potential support levels at $74.673 and $76.278. The price is consolidating below the resistance level, which could signify either accumulation before a breakout or distribution before a reversal.
Fibonacci Levels:
- The Fibonacci retracement levels from the swing low to swing high show potential support at the 0.786 level ($79.467) and resistance at the 1 level ($76.990). The chart also notes a bearish zone below the 1.272 extension ($73.841) and a bullish zone above the 0.786 level.
Volume Profile:
- The Volume Profile visible range of 74.80 suggests that the highest volume traded is below the current price level, which could act as a strong support zone in case of a retracement.
Technical Indicators:
- The Average True Range (ATR) is trending upward, indicating increased market volatility. The Momentum indicator is positive but appears to be flattening, suggesting that the bullish momentum may be slowing down.
Chart Patterns:
- There’s a possible test area highlighted around the $75.20-$74.80 range, suggesting that this could be a retest zone for support if the price retraces from current levels.
Overall Market Sentiment:
Positive Sentiment: 65% – The uptrend, the recent break above prior resistance levels, and the consolidation near the current high suggest a strong bullish sentiment. The rising ATR indicates active market participation, and the proximity to the bullish zone supports the positive sentiment.
Negative Sentiment: 20% – There is a potential for a bearish reversal if the price fails to breach the current resistance level. The bearish zone indicated below the 1.272 Fibonacci extension also contributes to negative sentiment.
Neutral Sentiment: 15% – The flattening momentum indicator suggests uncertainty, and the market may be waiting for further cues before establishing a clear direction. The consolidation phase also indicates a neutral wait-and-see approach by the traders.
Why and How Market Sentiment Could Change:
Positive to Negative Shift: If the current resistance holds and the price starts to reverse, this could signify a failed breakout, leading to a shift toward negative sentiment. Traders might look for increased volume on the downside as a confirmation of bearish control.
Negative to Positive Shift: A strong break above the $79 resistance with high volume could reinforce the bullish sentiment. If subsequent price action forms a new support level above this resistance, it could signal a continuation of the uptrend.
In both cases, external factors such as geopolitical events, changes in oil production or inventory levels, shifts in global economic outlook, and currency exchange rate fluctuations could significantly influence the market’s sentiment and the price of WTI crude oil.
Price analysis and Targets:($74-$79)
Scenario 1: Price Decline to $74
Why Prices Might Decline:
Oversupply Concerns: The expectation of continued oversupply in the oil markets can lead to weaker prices. With U.S. oil production growing and OPEC facing challenges in influencing prices due to increased output from non-OPEC+ countries, this could result in downward pressure on prices.
Moderate Demand Growth: Analysts predict moderate demand growth for oil in 2024, which may not be sufficient to absorb the expected supply levels, contributing to a potential decline in prices.
How Prices Might React:
Technical Resistance and Pullbacks: The approach to a strong resistance level near $79 could result in profit-taking and a pullback towards the $74 support level. If the momentum indicators show a decrease in strength as prices near resistance, this could signal a potential reversal.
Volume and Volatility: An increase in trading volume and volatility, particularly at key technical levels, could indicate a shift in market sentiment. If higher volume is accompanied by falling prices, it could suggest strong selling pressure moving prices down towards the support level.
Scenario 2: Bullish Trend Continues to $79
Why Prices Might Increase:
Geopolitical Tensions: Heightened geopolitical tensions, especially in key oil-producing regions, can lead to concerns about supply disruptions, which may drive up oil prices. The situation in the Middle East, particularly the activities in the Red Sea, could be a key factor in this regard.
Economic Optimism: If global economic conditions improve more than expected, it could lead to an increase in oil demand, pushing prices upward.
How Prices Might React:
Breaking Resistance: If the bullish sentiment is strong enough to push prices through the $79 resistance level, we could see a continuation of the upward trend. A break above resistance, especially on high volume, would confirm the strength of the trend.
Market Sentiment and Momentum: Positive news and investor sentiment can feed into the market momentum, driving prices higher. Technical indicators like RSI and MACD can provide signals for continued bullish momentum.
Influencing Factors for Both Scenarios:
- Supply Adjustments: Decisions by OPEC+ to adjust production levels and U.S. production trends can significantly influence market supply and oil prices.
- Global Economic Conditions: Predictions of weak global economic growth could dampen demand for oil, while signs of recovery could stimulate it.
- Technical Chart Patterns: Traders will closely watch chart patterns and technical indicators for potential breakout or breakdown signals.
- U.S. Dollar Strength: Oil prices are inversely related to the strength of the U.S. dollar, as oil is traded in dollars globally.
In conclusion, the future direction of WTI crude oil prices will depend on a complex interplay of technical factors, market sentiment, geopolitical developments, and macroeconomic conditions. Market participants will be closely monitoring these factors to gauge the potential for either scenario to unfold, and they will adjust their strategies in response to these cues.
What Kind of Technical Patterns we Should Observe
Influence of News on Technical Factors:
- Supply Adjustments: News of Saudi Aramco maintaining its capacity at 12 million bpd, rather than increasing it, could be interpreted as a sign of a balanced or oversupplied market. This might temper bullish sentiment unless offset by escalating Middle East tensions or sanctions on Venezuelan oil.
- U.S. Crude Inventory Data: The reported drop in U.S. crude stocks by the American Petroleum Institute could lend support to prices, as a decrease in inventories is typically a bullish signal. Confirmation by the official U.S. government data could reinforce this.
- OPEC+ Meeting Outcomes: Anticipation around the OPEC+ meeting could lead to increased volatility as traders speculate on possible production adjustments.
- Geopolitical Risk: President Biden’s response to the drone attack and the situation in the Middle East can create significant price movements if the market perceives a risk to oil supply.
Scenario 1: Technical Reaction if Prices Decline to $74
Why Prices Might Decline:
- Demand Concerns in China: The issues with China Evergrande Group and the real estate crisis could lead to a broader economic slowdown in China, potentially dampening the demand for crude oil.
- Profit-taking: Following the recent price surge due to the upgraded global economic growth forecast, traders might decide to lock in profits, leading to a short-term decline in prices.
How Prices Might React Technically:
- Liquidity and Support Levels: As prices decline, we might expect increased liquidity at the $74 level, where buyers may anticipate value. This could lead to price absorption, where the selling pressure is met with buying interest, potentially halting the decline.
- Volatility Increase: The ATR may rise as prices approach key support levels, reflecting the uncertainty and the potential for rapid price changes in either direction.
- Volume Analysis: A decline on significant volume could indicate strong selling pressure, but if volume decreases as prices approach $74, it could suggest that the downward momentum is waning, and a potential rebound may occur.
Scenario 2: Technical Reaction if Bullish Trend Continues to $79
Why Prices Might Increase:
- Global Economic Growth: The IMF’s upgraded forecast for global economic growth, especially for the U.S. and China, may lead to higher oil demand expectations.
- Middle East Tensions: Escalating tensions in the Middle East can create supply fears, pushing prices higher as market participants factor in risk premiums.
How Prices Might React Technically:
- Breaking Resistance: If bullish sentiment drives prices to test the $79 resistance level again, a breakout on high volume could confirm the move and potentially lead to a new trading range with $79 as support.
- Momentum Indicators: Indicators such as RSI and MACD could show increasing momentum, supporting the move higher if they align with the price action.
- Order Flow Dynamics: A sustained move towards $79 could lead to a liquidity push above this level as breakout traders place buy orders, and stop losses from short positions get triggered, further propelling the price upward.
In summary, technical resistance and support levels will play a crucial role in how prices react, with technical indicators providing traders with signals that might confirm or negate the influence of fundamental news. The interplay between technical analysis and evolving news will determine the market’s direction in the short term.
Conclusion
In conclusion, the current crude oil price dynamics are influenced by a delicate balance of both fundamental and technical factors. Recent developments, such as the upgraded global economic growth forecast, ongoing tensions in the Middle East, and geopolitical events, have all contributed to the oil market’s sentiment.Technically, the price of WTI crude oil is navigating critical support and resistance levels, with traders closely monitoring indicators like the Average True Range (ATR), momentum, and volume profiles for cues on market direction.Looking ahead, the market’s sentiment can shift swiftly based on news related to supply adjustments, U.S. crude inventory data, outcomes of OPEC+ meetings, and geopolitical risks. Two possible scenarios have been outlined: one where prices decline to $74, driven by concerns about China’s demand and profit-taking, and another where the bullish trend continues to $79, supported by improved global economic growth and Middle East tensions.
To know more about CMS Prime visit us at https://cmsprime.com
Disclaimer: This is not an Investment Advice. Investing and trading in currencies involve inherent risks. It’s essential to conduct thorough research and consider your risk tolerance before engaging in any financial activities.


