Current Factors Influencing Current Gold Prices:
Gold prices continued their decline on Wednesday, remaining below the critical $2,000-per-ounce threshold. This was driven by a stronger-than-expected U.S. inflation report, causing investors to scale back expectations of rate cuts by the Federal Reserve.
Spot gold fell by 0.2% to $1,989 per ounce, marking its lowest level since December 13th. The previous day, gold experienced a 1.4% drop, its largest single-day decline since December 4th.
U.S. gold futures also slipped by 0.2% to $2,002 per ounce.
Market analyst Carlo Alberto De Casa noted that the dovish outlook prevalent in recent months has dissipated, with investors now expecting the Fed to maintain higher rates for a longer period.
Data released on Tuesday revealed that U.S. consumer prices rose more than anticipated in January, registering a 3.1% annual increase, surpassing forecasts of a 2.9% rise.
Traders have adjusted their expectations, aligning more closely with the Fed’s “dot plot” released in December, which suggested fewer rate cuts. It is now anticipated that the Fed may delay any interest rate cuts until June.
According to the CME Fed Watch Tool, traders currently estimate a 78% likelihood of a rate cut in June. Lower interest rates tend to enhance the appeal of gold, which does not offer yields.
The U.S. dollar index hovered close to a three-month peak, while 10-year Treasury yields remained near a 2-1/2-month high.
Investors will turn their attention to U.S. retail sales data scheduled for release on Thursday, as well as producer price index figures due on Friday. Additionally, five Fed officials are expected to deliver speeches throughout the week.
Citi Research suggested in a note that the gold market may experience a tactical correction to the range of $1,925 to $1,950 over the next 1-3 months, presenting a buying opportunity.
Fundamental and Technical Analysis
Technical Overview:
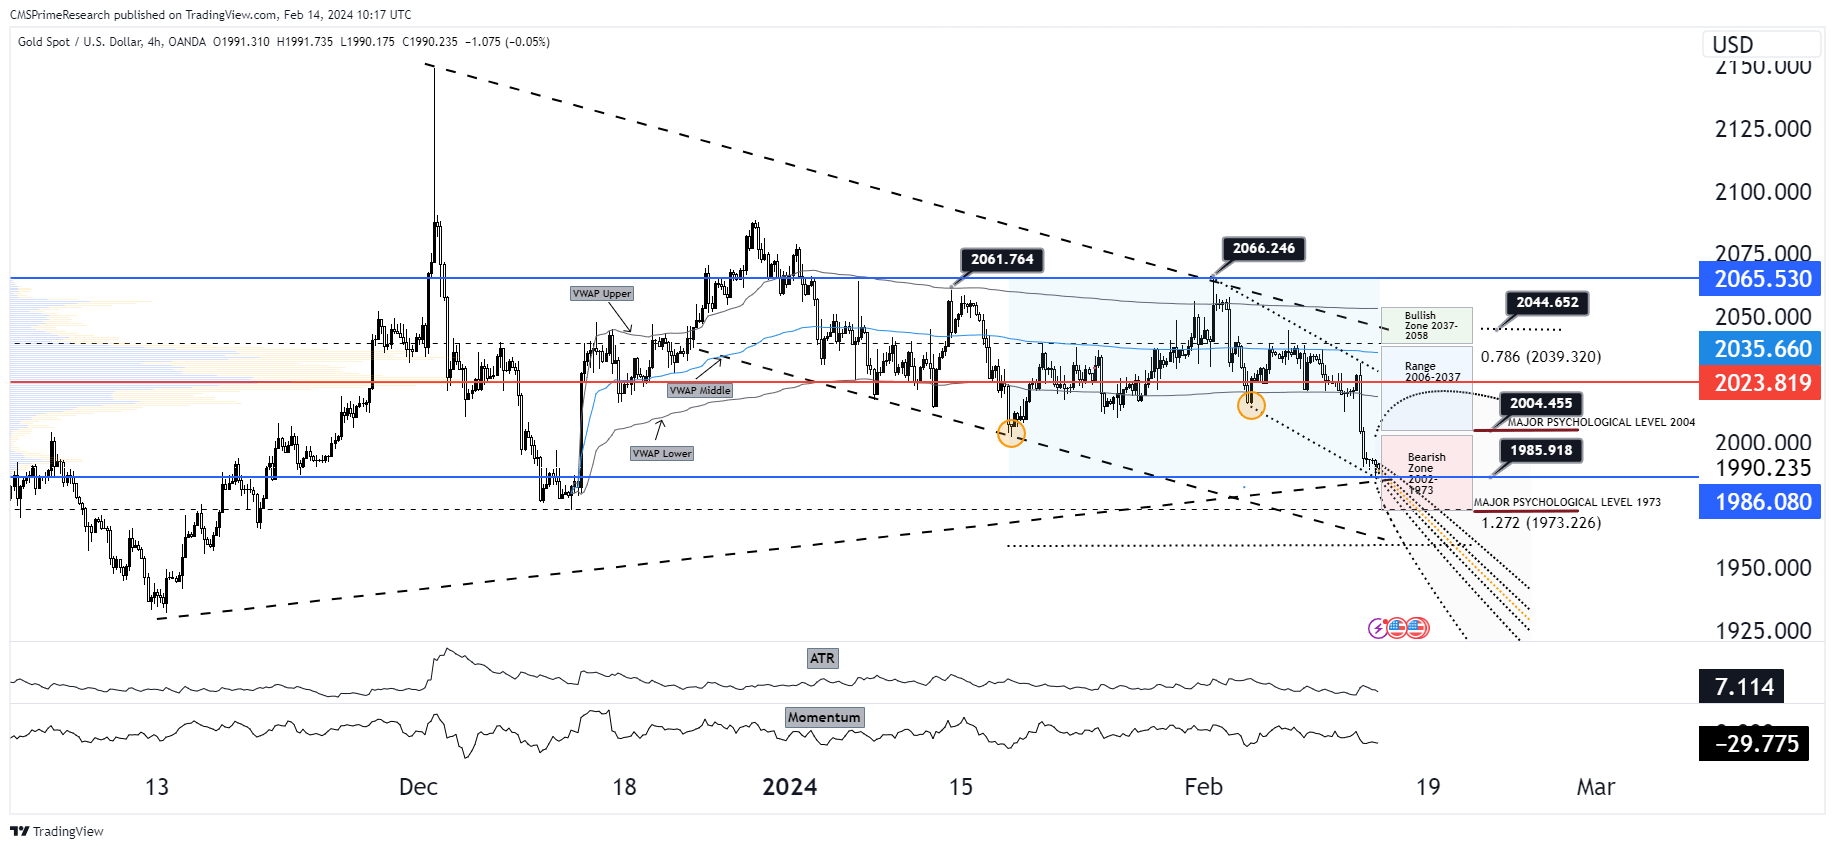
The chart presents a bearish picture as gold prices slide below the critical $2,000 level:
Support and Resistance:
- Immediate resistance is observed at the $1995 and 2000 level, with further resistance at the $2003 and 2009 price point.
- Current support is around $1986.080, corresponding with the low seen on December 13th. A break below this level could see gold target the $1973 psychological level, indicated by the 1.272 Fibonacci extension.
Volume-Weighted Average Price (VWAP) Bands:
- Prices are trading below the VWAP middle band, indicating bearish sentiment in the short-term market.
Technical Indicators:
- The Average True Range (ATR) suggests decreasing volatility, which could mean the bearish trend is stabilizing.
- The negative momentum indicates that the downward trend is still in force, with the possibility of continuation.
Fundamental Analysis:
Recent economic developments have had a significant impact on gold prices:
U.S. Inflation Report:
- The higher-than-expected inflation data have dampened expectations for Fed rate cuts, as persistent inflation may keep rates higher for longer.
Federal Reserve Outlook:
- The adjustment of trader expectations in line with the Fed’s dot plot indicates a bearish outlook for gold, as the delay in rate cuts reduces the metal’s attractiveness.
Dollar and Treasury Yields:
- The strength of the dollar and the high Treasury yields create headwinds for gold, as they offer yield-bearing alternatives to the non-interest-bearing metal.
Scenario Analysis:
Bullish Scenario (20% Probability):
- Any unexpected dovish shift by the Fed or weak retail sales and PPI data could trigger a short-covering rally, pushing gold towards resistance at $2014
- Price Target: $2009 – $2014
- Sentiment Analysis: A dovish surprise would increase positive sentiment to 30%, but this is the least likely scenario given the current economic backdrop.
Bearish Scenario (60% Probability):
- If upcoming economic data confirms the inflationary pressure and the Fed maintains a hawkish stance, expect gold to break support at $1975 and head towards $1969 or even lower.
- Price Target: $1970 – $1925 to $1950 (as per Citi Research’s tactical correction range)
- Sentiment Analysis: Negative sentiment dominates at 60%, reflecting the market’s adjustment to the likelihood of sustained higher rates.
Neutral Scenario (20% Probability):
- In the case of mixed data and cautious Fed commentary, gold may continue to oscillate around the current levels, seeking direction.
- Price Target: Consolidation within $1986.080 – $2009
- Sentiment Analysis: Neutral sentiment remains at 20%, highlighting the market’s indecision in the absence of new drivers.
Overall Market Sentiment Forecast:
- Positive Sentiment: Lowered to 20%, as the market adjusts to the reality of persistent inflation.
- Negative Sentiment: Heightened to 60%, with the risk of further drops if economic data remains strong.
- Neutral Sentiment: Holding at 20%, showing the market’s current wait-and-see approach.
Overall Market Sentiment: 20% Positive, 60% Negative, 20% Neutral.
Target Levels and Analysis--- 1950-1973 or 2003-2013
Given the current economic backdrop and technical analysis of gold prices, a strategic approach targeting the specified price ranges of $1950-$1973 for a bearish outlook and $2003-$2013 for a bullish recovery must be adeptly crafted. The strategy is predicated on the recent stronger-than-expected U.S. inflation report, the subsequent adjustment of Federal Reserve rate cut expectations, and the technical indicators signaling a bearish trend.
Strategy Overview
This strategy leverages the dominant market sentiment and technical analysis to position for potential price movements within the identified target zones, incorporating risk management principles and scenario-based planning.
Detailed Strategy
Initial Condition and Contextual Analysis:
- The bearish sentiment is currently dominating the gold market, with a 60% probability, primarily due to persistent inflation concerns and adjustments in Fed rate cut expectations. The technical analysis supports this outlook, indicating a potential further downside.
2 Scenarios:
- Bearish Target Zone ($1950-$1973): This range is considered under the current economic conditions and the bearish scenario’s high probability (60%). Traders should prepare for a continuation of the downtrend, targeting entry points near the upper end of this zone for short positions.
- Bullish Recovery Zone ($2003-$2013): Although less likely, a 20% bullish scenario probability suggests a potential for a short-covering rally if unexpected dovish Fed shifts or weak economic data emerge. Entry points for long positions should be considered near the lower end of this range.
Entry Points, Stop-Loss, and Profit Targets
Bearish Position Entry: Initiate short positions near $1973, the upper end of the bearish target zone, or on a rebound towards this level. This entry point is predicated on the anticipation of breaking below current support levels.
Bullish Position Entry: Consider long positions near $2003, especially if there are signs of weakening dollar strength, dovish Fed commentary, or disappointing economic data that could trigger a rally.
Stop-Loss Orders:
- For bearish positions, place stop-loss orders slightly above the $1973 level to protect against sudden bullish reversals.
- For bullish positions, set stop-loss orders below $2003 to mitigate losses in case the expected rally does not materialize.
Profit Targets:
- Bearish trades should aim for profits at the lower end of the target zone ($1950), adjusting based on market momentum and emerging economic indicators.
- Bullish trades could target profits towards the upper end of the recovery zone ($2013), with the flexibility to adjust targets higher if positive sentiment increases.
Risk Management and Adjustments
Portfolio Allocation: Diversify allocations between bearish and bullish positions based on the current sentiment analysis and scenario probabilities. This balanced approach helps mitigate risk in a volatile market environment.
Sentiment Monitoring: Continuously monitor market sentiment, economic data releases, and Fed communications. Be prepared to adjust the strategy in response to significant changes in these factors.
Technical and Fundamental Review: Regularly reassess technical indicators and fundamental developments. Pay particular attention to the U.S. dollar index movement, Treasury yields, and upcoming economic data, as these can provide early signals for adjusting positions.
Conclusion
This strategy aims to navigate the volatility and uncertainty in the gold market by leveraging a scenario-based approach informed by current economic conditions, market sentiment, and technical analysis. By carefully managing risk and staying attuned to market developments, traders can position themselves to capitalize on movements within the specified bearish and bullish target zones. Continuous reassessment and flexibility in response to new information will be crucial for the successful execution of this strategy.
To know more about CMS Prime visit us at https://cmsprime.com
Disclaimer: This is not an Investment Advice. Investing and trading in currencies involve inherent risks. It’s essential to conduct thorough research and consider your risk tolerance before engaging in any financial activities.