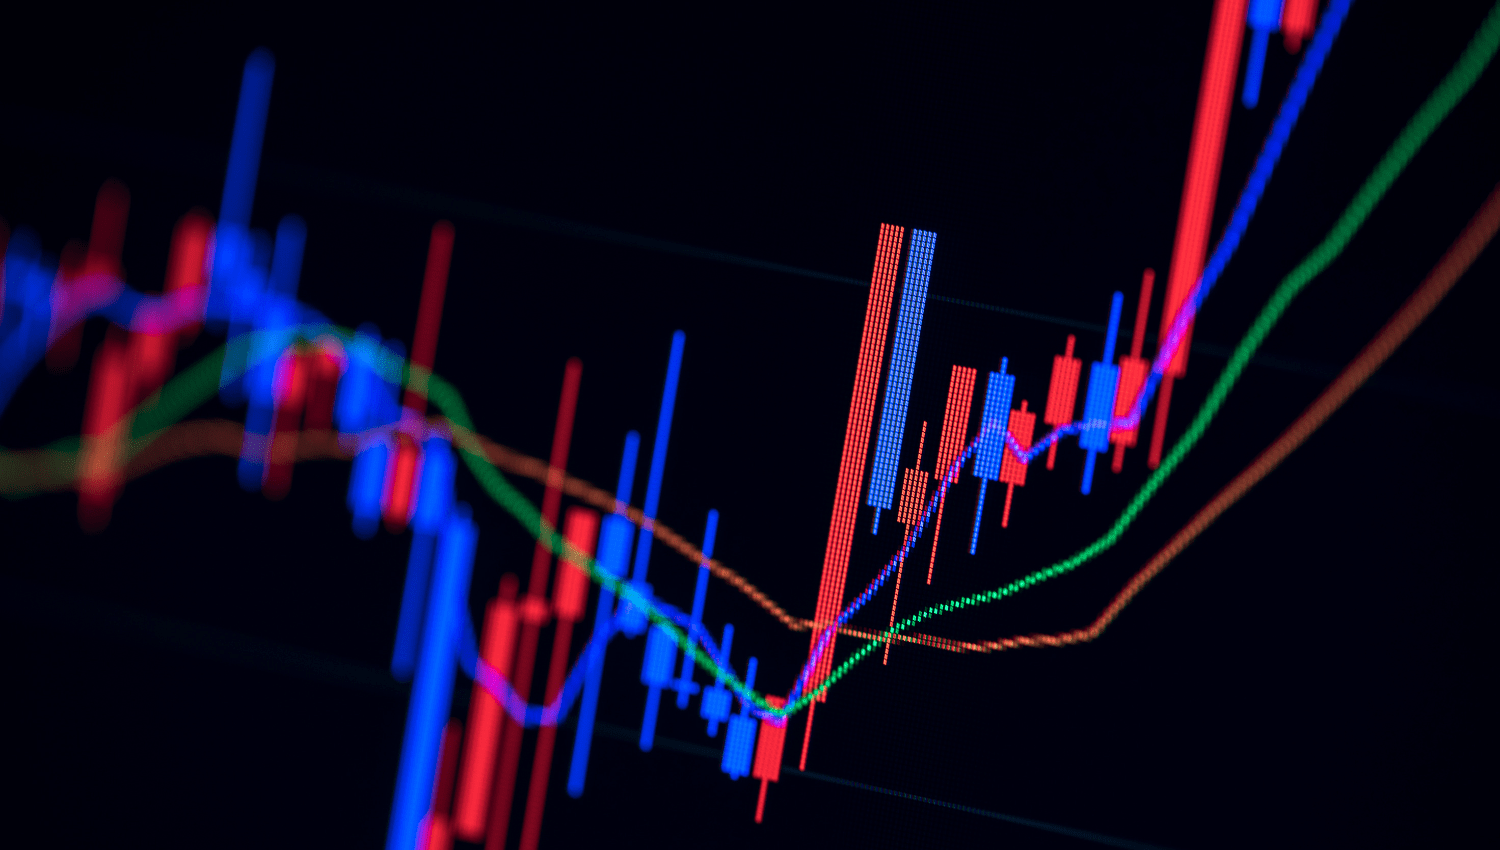
Moving averages (MAs) are a cornerstone of technical analysis, widely used to gauge long-term trends in financial markets. By smoothing out fluctuations in price data, moving averages help traders and investors discern the overall market direction, reduce noise, and make data-driven decisions based on historical trends. This article delves into the various types of moving averages, their role in long-term trend analysis, and how they can be effectively integrated into trading strategies.
What Are Moving Averages?
A moving average calculates the average of a set of data points over a given time frame, adjusting as new data points become available. As the oldest data point is replaced by the newest, the average shifts or “moves,” thus earning its name.
There are several types of moving averages, each calculated differently:
Simple Moving Average (SMA): The SMA is the most straightforward moving average, calculated by adding up the prices over a specified period and dividing by the number of periods. For instance, a 50-day SMA takes the sum of the closing prices over the last 50 days and divides it by 50, giving equal weight to each data point.
Exponential Moving Average (EMA): The EMA places more emphasis on recent prices, making it more responsive to recent market changes compared to the SMA. It uses a formula that applies a higher weight to the latest price points, gradually decreasing the weight of older data.
Weighted Moving Average (WMA): The WMA assigns varying weights to each data point, usually giving more importance to recent prices. This method provides a middle ground between the SMA and EMA, allowing traders to focus more on recent data while still considering the overall trend.
Moving Averages and Long-Term Trend Analysis
Moving averages are particularly useful for identifying long-term trends, as they smooth out short-term market volatility, providing a clearer view of the overall market direction. In the context of long-term trend analysis, moving averages can assist traders in several ways:
Trend Identification: The direction of the moving average line can indicate whether the market is trending upward, downward, or sideways. A rising moving average suggests an uptrend, while a falling one indicates a downtrend.
Trading Signal Generation: Moving averages are often used to generate buy and sell signals. For example, the “Golden Cross” occurs when a short-term moving average (e.g., 50-day SMA) crosses above a long-term moving average (e.g., 200-day SMA), signaling a potential uptrend. Conversely, the “Death Cross” happens when the short-term moving average crosses below the long-term moving average, suggesting a possible downtrend.
Support and Resistance: Moving averages can also serve as dynamic support and resistance levels. In an uptrend, the moving average often acts as a support level, where prices tend to rebound during pullbacks. In a downtrend, it may function as a resistance level, where prices struggle to break above.
Implementing Moving Averages in Long-Term Strategies
When applying moving averages for long-term trend analysis, it’s crucial to choose the appropriate time frame that aligns with your trading objectives. Long-term traders typically use moving averages with periods of 50, 100, or 200 days.
Trend Following: This strategy involves buying when the price is above the moving average and selling when it’s below. This approach helps traders stay aligned with the market trend and avoid short-term noise.
Crossover Strategy: The crossover strategy uses two moving averages with different periods, such as the 50-day and 200-day SMAs. A buy signal is generated when the shorter moving average crosses above the longer one, while a sell signal is generated when the shorter moving average crosses below the longer one. This strategy is particularly effective in trending markets.
Moving Average Envelope: This strategy involves creating bands around a moving average by adding and subtracting a fixed percentage. The envelope can help identify overbought and oversold conditions, providing opportunities to enter or exit positions when prices reach extreme levels.
The Limitations of Moving Averages
Despite their usefulness, moving averages have some limitations:
Lagging Nature: Since moving averages are based on past data, they are lagging indicators and may not provide timely signals in rapidly changing markets, leading to delayed entries or exits.
Whipsaw in Sideways Markets: In choppy or sideways markets, moving averages can generate false signals, causing traders to enter and exit positions frequently without significant gains.
Sensitivity to Period Length: The effectiveness of moving averages depends on the chosen period. A short moving average may be too sensitive to market fluctuations, while a long moving average might lag behind the trend.
Conclusion
Moving averages are powerful tools for analyzing long-term trends in financial markets. By smoothing price data and offering clear signals, they help traders and investors make informed decisions and stay aligned with the prevailing market direction. However, moving averages should be used alongside other analysis techniques and not relied upon solely. When applied correctly, moving averages can enhance trading strategies and improve the ability to identify and capitalize on long-term market trends.
Disclaimer: This is not an Investment Advice. Investing and trading in currencies involve inherent risks. It’s essential to conduct thorough research and consider your risk tolerance before engaging in any financial activities.


