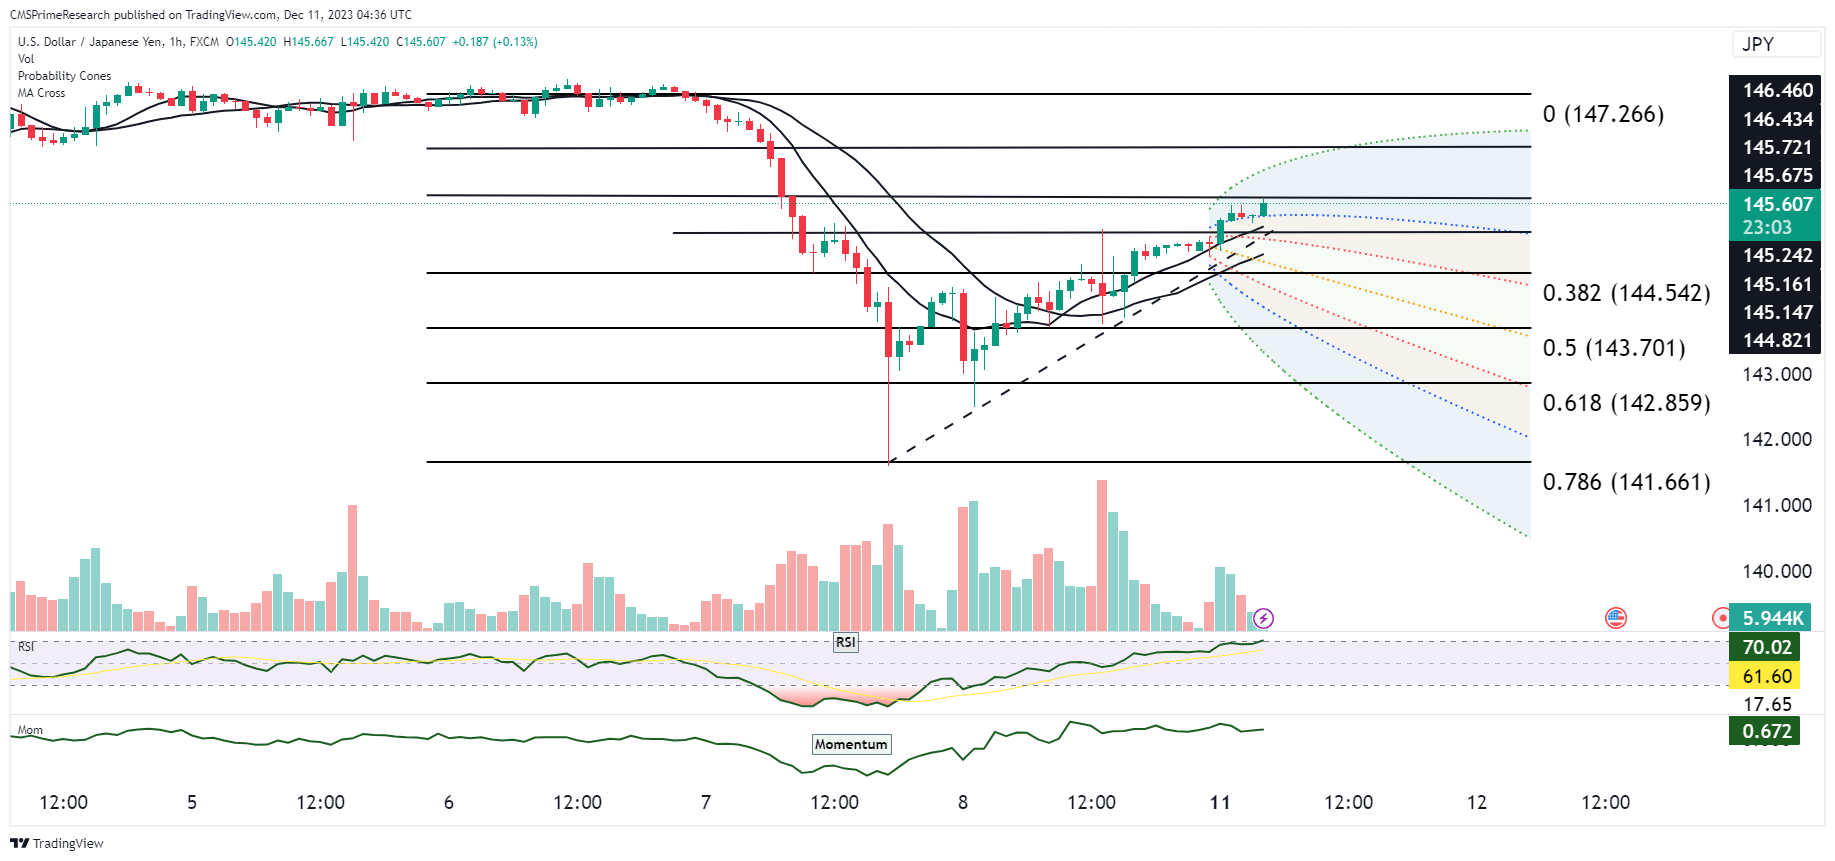
The chart shows a short-term time frame where the price of USD/JPY is experiencing volatility within a defined range. A ascending channel is indicated by two parallel dashed lines, suggesting that the price has been moving within a uptrend. These levels are derived from a recent high and low price point and are used to predict potential support or resistance levels. Notable Fibonacci levels on the chart include 0.382 (144.542), 0.5 (143.701), and 0.618 (142.859), which traders may monitor for price reactions. The RSI is hovering around the mid-level, which does not indicate an overbought or oversold market condition. However, its relative position can provide clues to the momentum’s strength. A momentum indicator crossing above zero can signal increasing buying pressure, while a cross below can signal increasing selling pressure.
The price is currently near the upper boundary of the ascending channel, suggesting a potential resistance test. The recent price action has not breached the upper channel line, which would be necessary for a trend reversal to be confirmed. The Fibonacci levels will serve as key zones to watch for potential price retractions or breakthroughs.
The technical analysis of the USD/JPY currency pair suggests that the price is experiencing a retracement toward the 200-period moving average on a 4-hour timeframe after hitting a four-month low. The analysis indicates a bullish momentum that could continue if the price breaches above the upper bound of the Donchian channel at 145.60, which could serve as an entry point for a long position. A stop loss could be placed below 141.66, adjusting to the next fractal low following Parabolic signals.
Fundamentally, Japan’s business sentiment has improved in the fourth quarter, with the Business Survey Index (BSI) reaching a two-year high. This improvement in sentiment is generally bearish for USD/JPY, suggesting that the price could reverse from the rebound. However, large Japanese manufacturing firms are expecting business conditions to deteriorate in the upcoming quarters, which could influence the currency pair’s future direction. The combination of technical indicators and fundamental data provides a nuanced view of the potential price movements in the USD/JPY pair. It’s important to consider both technical analysis and fundamental factors when forecasting currency movements, as they can often provide complementary insights.