USD/JPY has fallen as investors unwind yen-funded risk-on trades, breaking key support levels. The disappointing U.S. JOLTS report on Tuesday heightened concerns that Treasury yields and prices may not sustain May’s support levels if upcoming ISM services and jobs reports also underperform.
The 2-year Treasury-JGB yield spread has decreased by 37 basis points from May’s 2024 peak. To prevent a broader slide in USD/JPY, especially towards May’s lows near the 2023.22 peak at 152, the upcoming U.S. data, particularly Friday’s jobs report, must indicate stability or strength.
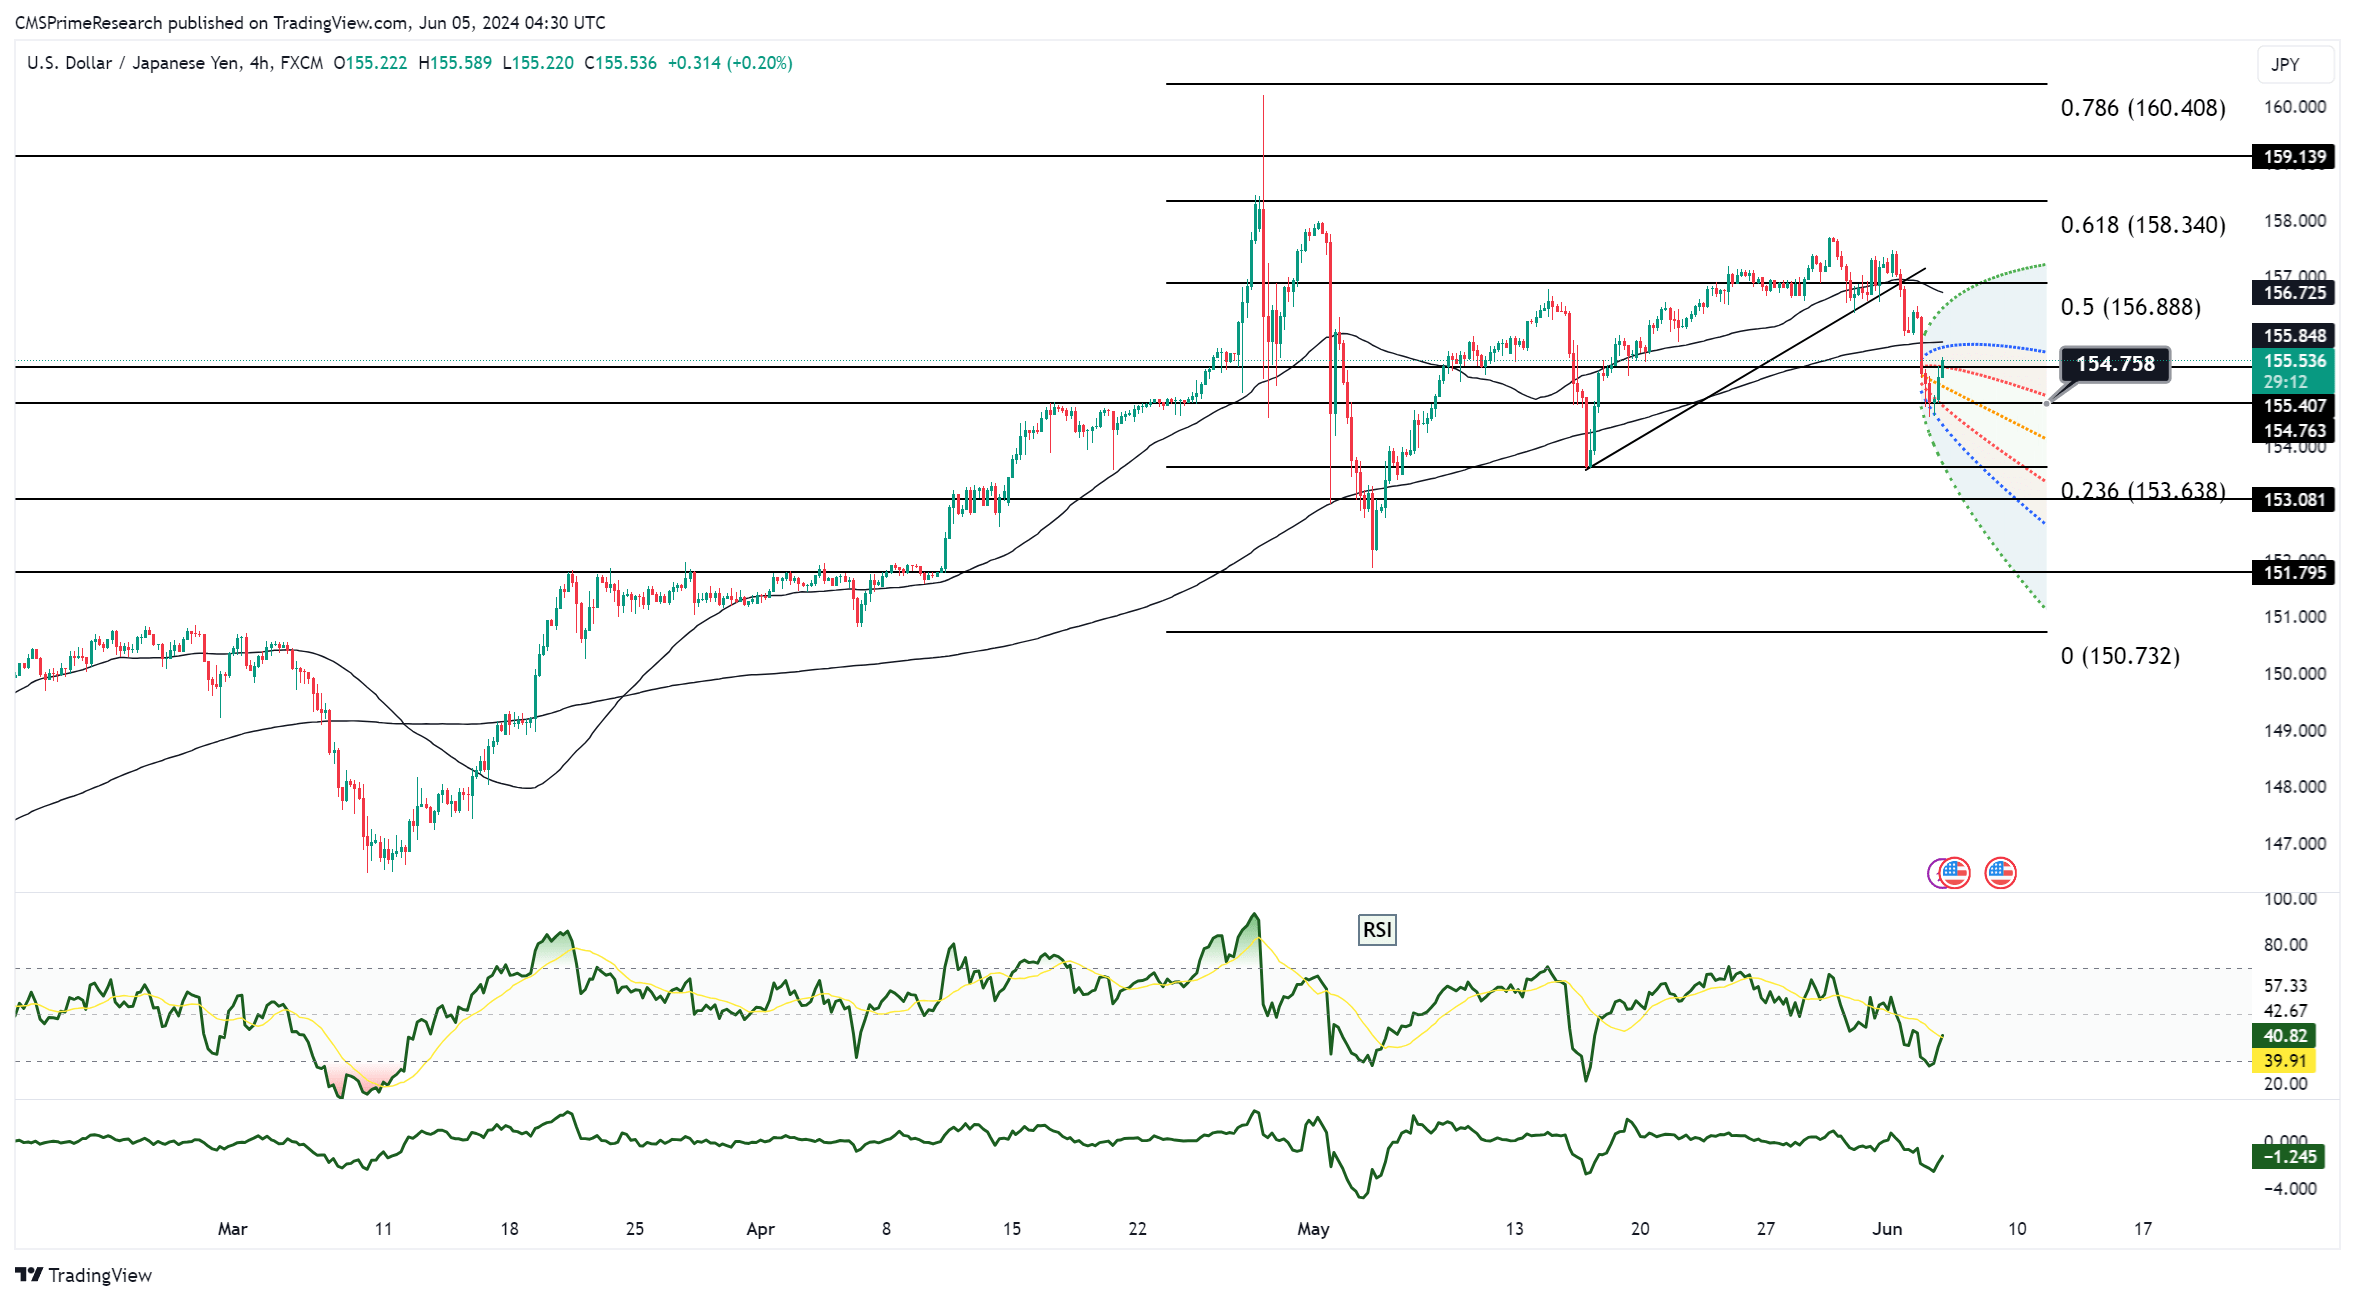
USD/JPY rebounded from the 154.55 lows, near the 55-day moving average at 154.44, which had previously helped reverse May’s post-intervention drop. However, today’s decline into the daily cloud and the first drop in the kijun since January bring the cloud base at 153.36 into focus. Despite a 3.9bp and 5.1bp decline in two- and 10-year Treasury yields, they have remained above May’s crucial lows of 4.704% and 4.31%. Before the weak JOLTS report, Treasury yields and USD/JPY prices were oversold, prompting some profit-taking support. Futures now strongly predict Fed rate cuts in September and December, a shift from last week’s skepticism about more than one cut.
The Bank of Japan (BoJ) is anticipated to raise rates at least twice by year-end, moving towards using JGB purchases to control the pace of rising longer-term yields rather than stopping it completely. This approach diminishes the upside potential for USD/JPY as the risk of intervention decreases.