
The Japanese Yen has recently demonstrated a notable weight against the USD and various crosses, influenced heavily by vigorous activities from Japanese exporters during the Gotobi Tokyo fix and substantial sales figures. USD/JPY observed a shift from 149.11 down to 148.26 before regaining some stability, with the further decline in US yields playing a significant role. Importantly, Tokyo has ruled out any foreign exchange intervention on the past Tuesday. Moreover, the Bank of Japan (BOJ) has once again stepped in with operations designed to cap yields. The Nikkei index experienced an uptick, correlating with a Wall Street rally, increasing by 1.2% and closing the Tokyo Stock Exchange (TSE) AM session at 30,886.
Regarding the USD/JPY pair, an uptrend has been noted, being in a limbo conditioned by Ministry of Finance (MoF) actions and US data while lingering below the 150 mark, ahead of payroll data. The pair, which traded within a confined 148.73-149.32 range on Wednesday, continues to show signs of post-traumatic stress following Tuesday’s 150.165-147.30 post-JOLTS dive.
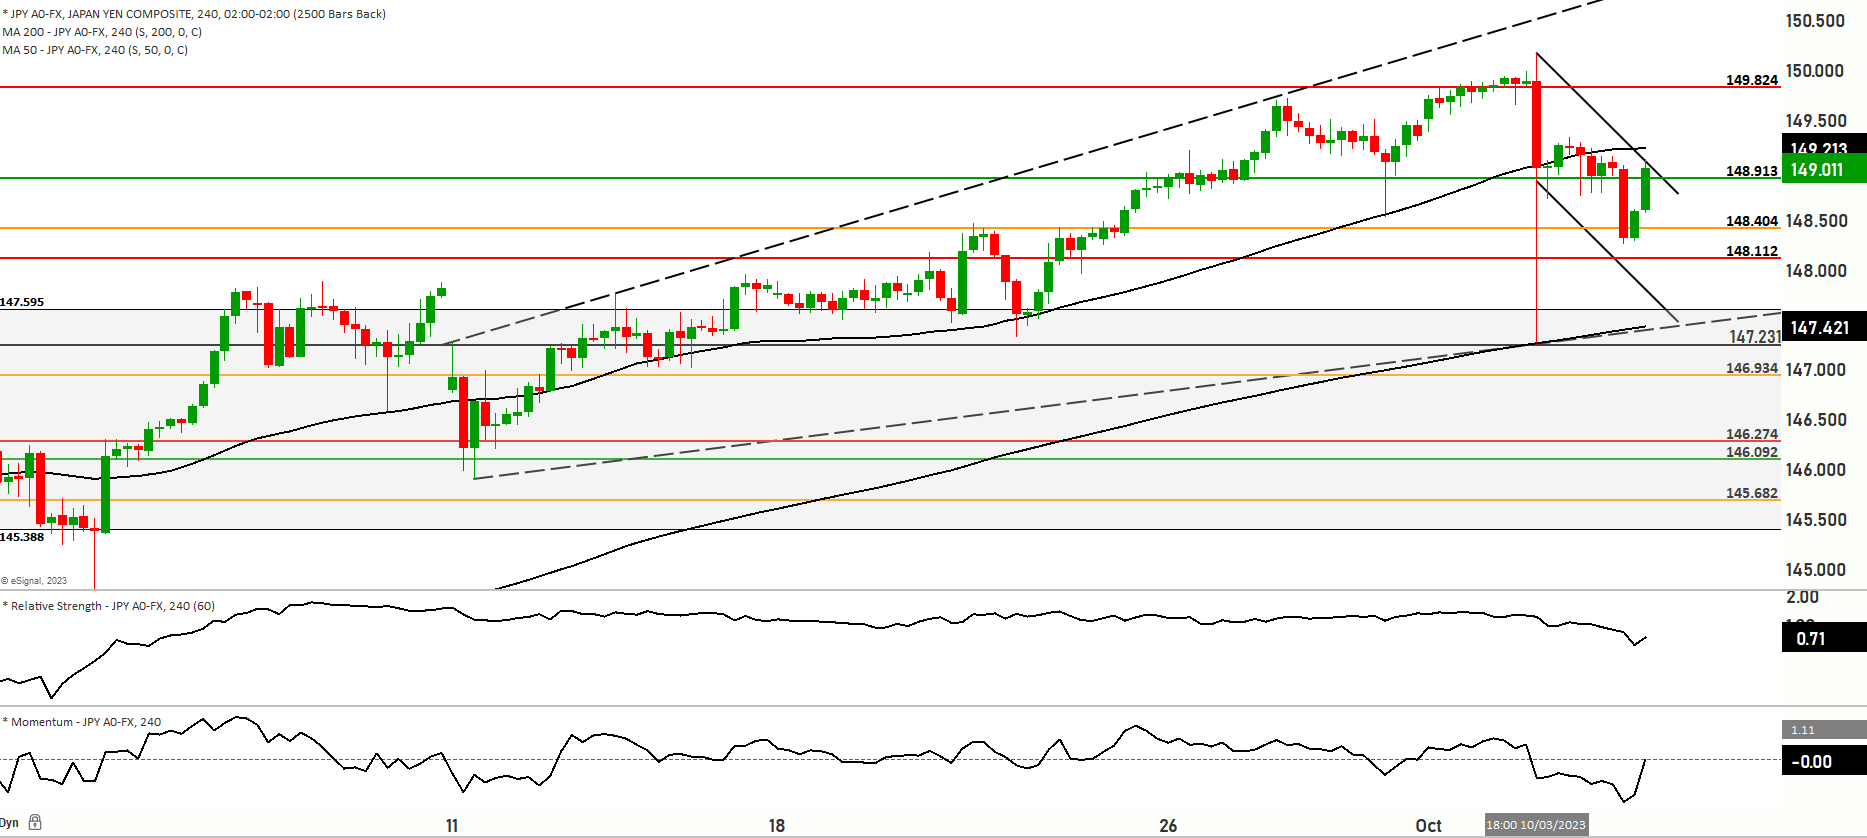
Navigating through various potential scenarios for USD/JPY reveals a multitude of possible paths. In the first scenario, should bullish momentum prevail, prices may seek to retest the 148.695 level and, if sustained, could propel further to challenge the 148.913 level. The upper resistance levels are eyed at 149.200 and 149.454, with 149.584 standing as a major resistance. Alternatively, the second scenario underscores a possible downturn towards the 148.112 level, and if successfully breached, a deeper dive towards 147.866 could be on the horizon. Further support levels to observe are 147.548 and 147.231.