


The Japanese Yen’s outlook has been analyzed following the release of the Bank of Japan (BoJ) minutes from their July meeting. The minutes indicated that members felt it was important to explain the tweaks to the Yield Curve Control (YCC) policy. The USD/JPY pair is now in touching distance of the 150.00 psychological mark, which could be a significant level for the pair. Market participants are pricing in a 62% chance of a rate hike in January 2024. The BoJ has maintained ultra-low interest rates, making it an outlier among developed market peers. The dovish position of the BoJ has led to a rally in the USD/JPY pair, pushing it past the 148.00 handle.
The Japanese Yen has weakened due to interest rate differentials after the BoJ stood pat last week. The central bank judges that inflation is purely a function of global forces and that demand in Japan is still nowhere near strong enough to permit a rise in borrowing costs. The USD/JPY pair has been closing in on eleven-month highs, and the market suspects that the BoJ is more likely to step in and bolster the Yen at current levels.
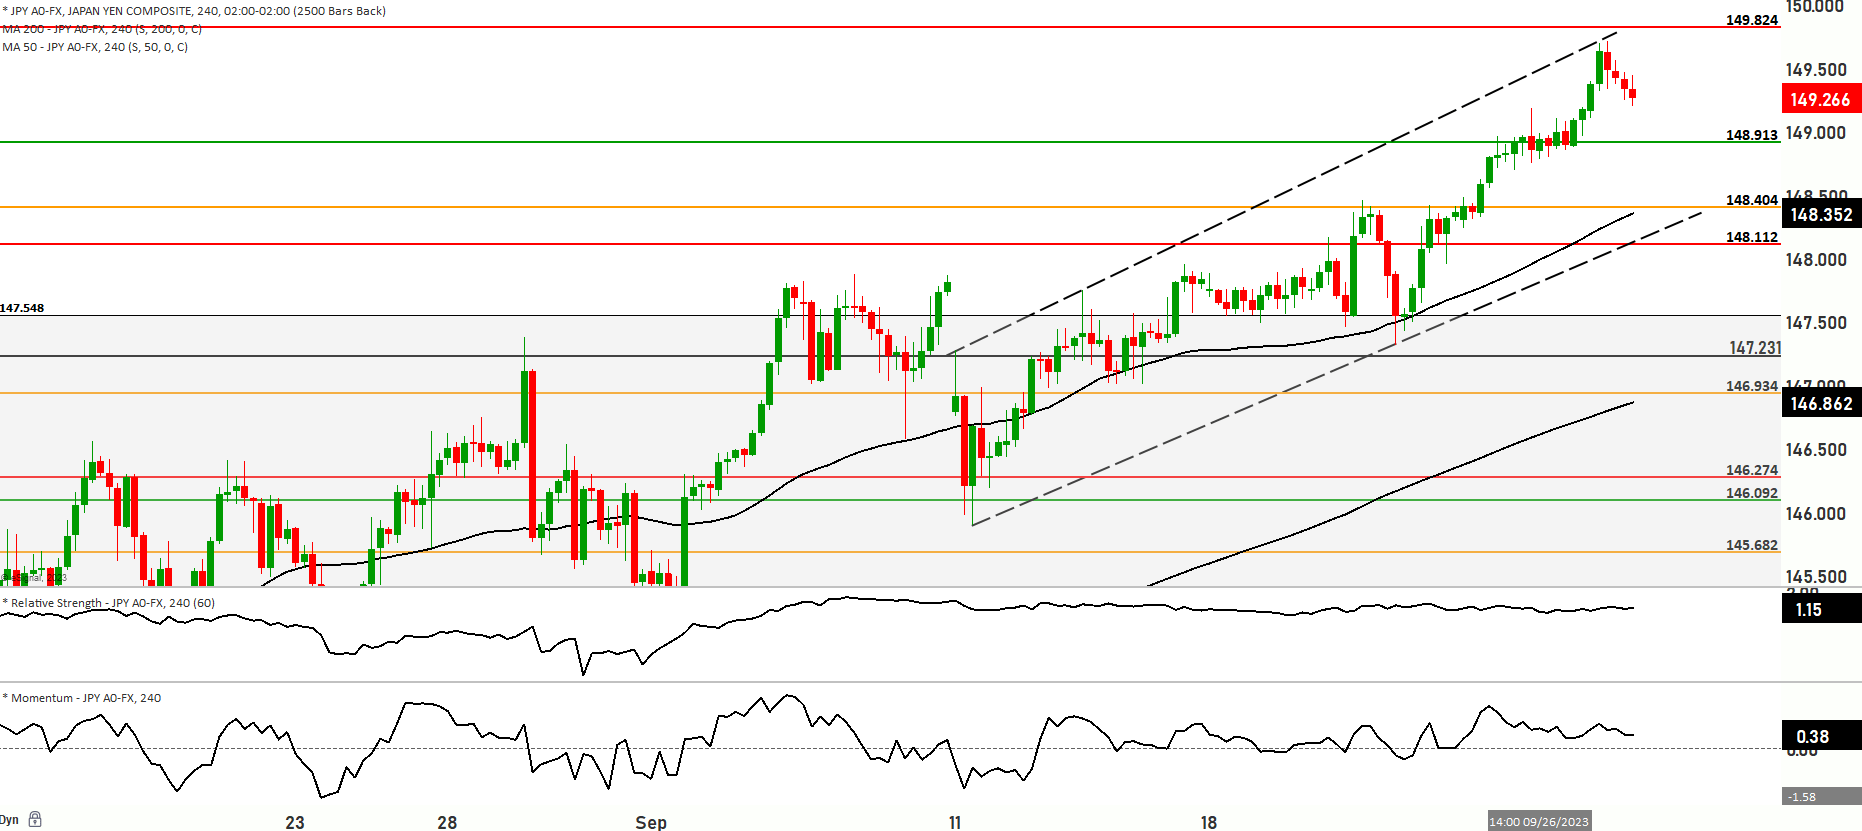
The Nikkei has seen a 1.73% decline, possibly due to selling activities ahead of the quarter-end and rising US Treasury (UST) yields. The yen’s recent weakness is mainly attributed to the overall strength of the US Dollar as UST yields continue to rise. Market participants are closely monitoring the situation for potential intervention by the Bank of Japan (BoJ), although such action would likely be prompted by yen weakness rather than a specific price level. Notably, in September, USD/JPY has seen a 2.6% increase, potentially prompting profit-taking at the end of the quarter. A key support level to watch is at 147.71, represented by the 21-day moving average, which has served as a foundational level during the recent uptrend. The long-term target for this upward movement is a test of the 151.94 level, which was the trend high in 2022.
Currently, the USD/JPY price is trading around 149.380. It is noteworthy that the price is positioned above both the 50-day and 200-day Moving Averages, indicating a bullish momentum within a range. In Scenario 1, the price could continue to climb, potentially retesting the 149.405 level. If the bullish trend persists, further advancements may lead to a test of the 149.500 level, corresponding to the top of resistance level 1. Beyond that, the topmost resistance levels are at 149.650 and 149.750, with 149.824 as a significant resistance level. Conversely, in Scenario 2, the price might decline, targeting the 148.719 level. A successful test at this level could result in further downward movement toward 148.583, followed by support levels at 148.433 and 148.265. The market currently exhibits a bullish range momentum, but caution is warranted as a pullback from previous highs suggests overbought conditions, and the Relative Strength Index (RSI) is approaching the overbought region. Traders should remain vigilant about potential price reversals.