Skip links

Seasonal Patterns, Disruptions, and Historical Trends in the Gold Market

Introduction

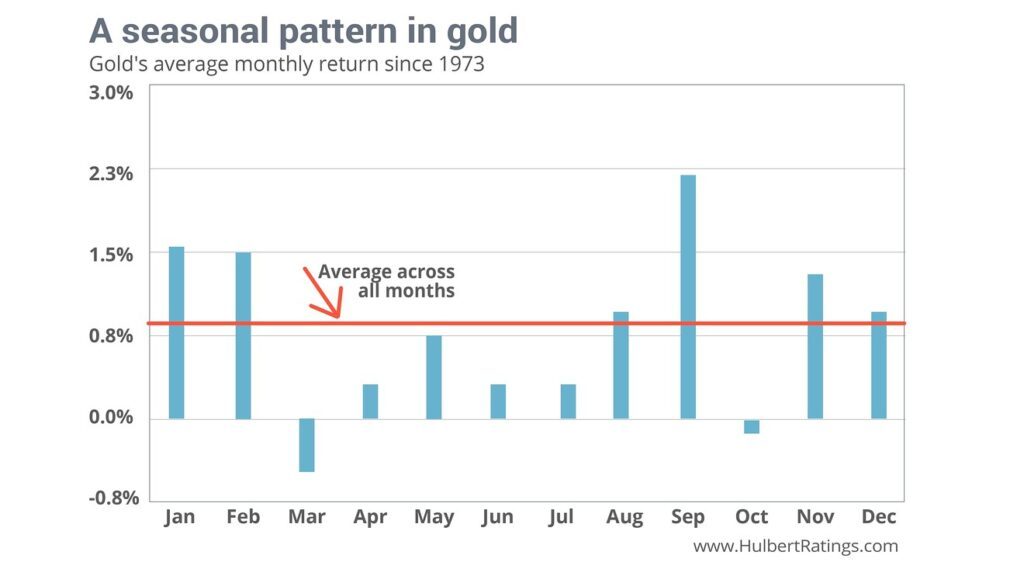
Within this complex landscape, seasonal patterns have historically played a role in shaping the trajectory of gold prices. These patterns offer traders and investors insights into potential opportune moments to enter or exit the market. However, it’s important to recognize that these trends are not infallible, and gold prices can be swayed by a multitude of global economic forces.

This exploration delves into the seasonal trends observed in the gold market, highlighting key moments such as India’s wedding season and the January effect. It also underscores the importance of being cautious and well-informed when utilizing these patterns for trading decisions. Beyond seasonal trends, we discuss events that have disrupted these patterns, emphasizing the dynamic nature of the gold market. Additionally, historical trends in the price of gold, from the Bretton Woods era to the 2020s, provide context for understanding how gold has evolved as an asset over the years.

By examining these historical and seasonal aspects, investors and traders can gain valuable insights into the potential fluctuations in gold prices and make informed decisions about their involvement in the gold market.

Seasonal Patterns and Gold Prices

Gold prices often follow patterns throughout the year providing traders and investors with insights to time their trades and investments. These are some trends, in the gold market;

  1. January Performance: Historically January has been a month for gold delivering a return of 1.6% over the past 50 years.
  2. Indian Wedding Season: Gold demand tends to rise during the wedding season, which typically spans from October to December.
  3. Diwali Festival: The Hindu festival of Diwali celebrated in either October or November is associated with increased demand, for gold.
  4. Holiday Shopping Season: Gold demand often sees an uptick during the holiday shopping season extending from November through December.
  5. Summer Season: It’s worth noting that gold prices have occasionally experienced a dip or slower activity during the summer months between June and August.

However, it’s important to recognize that these seasonal patterns may not always repeat themselves precisely and relying on them for trading decisions can be risky. Nevertheless, being aware of these trends can help traders and investors make choices and enhance their overall trading strategies.

Events that have disrupted Seasonal Patterns in Gold

Throughout history, there have been various events that have caused disruptions in the seasonal patterns of the gold market. Some of these events include;

  1. Impact of a strong US dollar; The strength of the US dollar has the potential to disrupt the seasonal trends in the gold market. Since gold is typically priced in US dollars, a stronger dollar can make gold more expensive for foreign investors, resulting in a decrease in its price.
  2. Fluctuations in interest rates; Changes in interest rates can significantly affect gold prices because its attractiveness as an investment depends on the prevailing interest rate environment. For example, during periods of declining interest rates, demand for gold may rise, leading to an increase in its price.
  3. Shifting demand patterns in China; Changes in gold demand from China can also disturb the usual seasonal patterns seen in the gold market. For instance, an unusually robust start to the year with increased demand for gold driven by concerns over a weakening renminbi and general uncertainty can alter typical seasonal trends.
  4. Impact of stock market collapses; A collapse or downturn in the stock market often prompts investors to seek safe haven assets like gold, disrupting regular seasonal patterns. For example, when the stock market experienced a significant collapse back in 2007, there was a surge in investment demand for gold that continued to rise steadily until 2011 when its value had doubled.

The Black Friday shopping season doesn’t have a direct impact on gold prices. As a result, it wouldn’t be considered a factor that disrupts the seasonal patterns in the gold market.

Historial Analysis of Gold Price Trends

Throughout its history gold has gone through trends and periods. Let’s take a look at some moments and shifts in the gold market;

  1. 1915 1970: During this period the price of gold remained stable thanks to the Bretton Woods system, which fixed it at $35 per ounce.
  2. 1970s: The 1970s witnessed a surge in the gold market as prices soared from around $35 per ounce in 1970 to over $800 per ounce by 1980. This era was characterized by factors like inflation, geopolitical tensions and the end of the Bretton Woods system.
  3. 1980s 1990s: In contrast to the decade gold prices declined during the 1980s and maintained relative stability throughout the following decade. At its point in 1999 gold was valued at around $250 per ounce.
  4. 2000s: The early years of this millennium saw a resurgence in gold prices due to factors such as uncertainty, low interest rates and increased investment demand. Ultimately this led to an all time high of $1,895.10 per ounce reached in 2020.
  5. 2020s: As we entered into this decade gold prices continued to fluctuate with highs and lows experienced along the way. In particular we saw prices reaching a peak of $2,058.40 per ounce in 2020. Also dipping down to as low as $1,811.27, per ounce by 2023.

These are some notable periods and trends that have shaped the fascinating world of gold throughout its history.

To sum up the gold market has witnessed patterns over time including phases of stability, surges and downturns. These patterns have been shaped by factors like inflation, geopolitical tensions and shifts in the economic landscape. By comprehending these trends investors can obtain valuable insights into the potential future fluctuations in gold prices and make well informed choices regarding their investments, in the gold market.

Conclusion:

The gold market is a fascinating arena where historical trends and seasonal patterns intertwine with global economic forces to shape its trajectory. While seasonal patterns like India’s wedding season and the January effect have historically influenced gold prices, it’s essential to approach these patterns with caution, recognizing that they may not always hold true in the face of evolving economic dynamics. Moreover, disruptions in these patterns can be triggered by factors such as a strong US dollar, fluctuations in interest rates, shifting demand from China, and stock market collapses. These disruptions highlight the need for a comprehensive understanding of the multifaceted factors that impact gold prices. Throughout its history, gold has gone through distinct phases, from stability under the Bretton Woods system to dramatic surges during times of inflation and geopolitical tension. The 2020s have brought further fluctuations, demonstrating the ongoing allure and uncertainty of this precious metal as an investment. In conclusion, the gold market remains a dynamic and ever-evolving domain, where historical context and seasonal patterns offer valuable insights, but where prudence, diversification, and a keen eye on the broader economic landscape are essential for successful trading and investment. Understanding the interplay of these factors equips individuals to navigate the golden path of this unique asset class.

Disclaimer: This is not an Investment Advice. Investing and trading in currencies involve inherent risks. It’s essential to conduct thorough research and consider your risk tolerance before engaging in any financial activities.