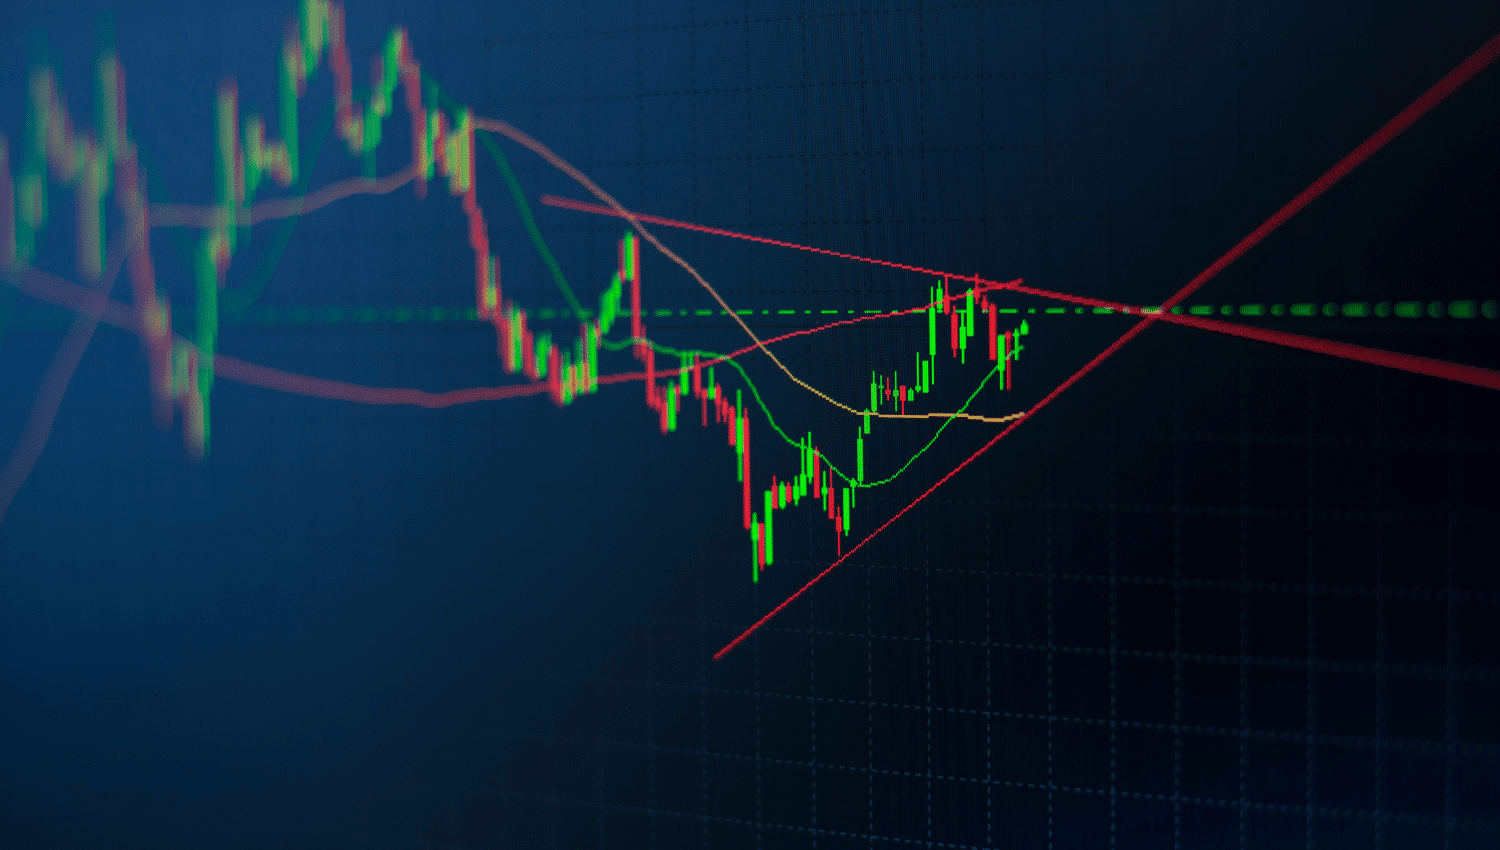
Forex trading offers numerous opportunities for traders to capitalize on bullish price movements. Identifying the right chart patterns is crucial for predicting these upward trends. Below, we explore some of the most reliable chart patterns that signal bullish price moves, providing you with the tools to enhance your trading strategy.
1. The Double Bottom
Description:
The Double Bottom pattern is a strong indicator of a potential bullish reversal. It forms after a sustained downtrend, characterized by two distinct troughs at roughly the same price level.
How to Trade:
- Entry Point: After the price breaks above the resistance level formed by the peak between the two bottoms.
- Stop Loss: Below the second bottom.
- Take Profit: Measure the distance between the bottoms and the peak, then project it upwards from the breakout point.
2. The Inverse Head and Shoulders
Description:
The Inverse Head and Shoulders pattern is another powerful bullish reversal indicator. It consists of three troughs: a lower trough (the head) between two higher troughs (the shoulders).
How to Trade:
- Entry Point: When the price breaks above the neckline connecting the peaks of the shoulders.
- Stop Loss: Below the second shoulder.
- Take Profit: Measure the distance from the head to the neckline and project it upwards from the breakout point.
3. The Ascending Triangle
Description:
The Ascending Triangle is a continuation pattern that often signals the continuation of a bullish trend. It features a rising lower trendline and a flat upper trendline (resistance).
How to Trade:
- Entry Point: When the price breaks above the resistance line.
- Stop Loss: Below the rising trendline.
- Take Profit: Measure the height of the triangle and project it upwards from the breakout point.
4. The Bullish Flag
Description:
The Bullish Flag pattern appears as a small consolidation phase (the flag) after a sharp price increase (the flagpole). It typically indicates a continuation of the bullish trend.
How to Trade:
- Entry Point: When the price breaks above the upper trendline of the flag.
- Stop Loss: Below the lower trendline of the flag.
- Take Profit: Measure the length of the flagpole and project it upwards from the breakout point.
5. The Cup and Handle
Description:
The Cup and Handle pattern is a bullish continuation pattern resembling a teacup. It consists of a rounded bottom (the cup) followed by a smaller consolidation (the handle).
How to Trade:
- Entry Point: When the price breaks above the resistance level formed by the rim of the cup.
- Stop Loss: Below the handle.
- Take Profit: Measure the distance from the bottom of the cup to the rim and project it upwards from the breakout point.
6. The Falling Wedge
Description:
The Falling Wedge is a bullish reversal pattern that forms during a downtrend, characterized by converging downward-sloping trendlines.
How to Trade:
- Entry Point: When the price breaks above the upper trendline.
- Stop Loss: Below the lower trendline.
- Take Profit: Measure the widest part of the wedge and project it upwards from the breakout point.
Strengths of Using Chart Patterns for Bullish Moves in Forex Trading
Chart patterns like the Double Bottom, Inverse Head and Shoulders, Ascending Triangle, Bullish Flag, Cup and Handle, and Falling Wedge offer traders a visual representation of market sentiment and potential price movements. One of the key strengths of these patterns is their ability to signal high-probability trading opportunities, allowing traders to enter positions with greater confidence. These patterns are based on historical price action, providing a reliable framework for predicting future movements. Additionally, they can be used across various timeframes, making them versatile tools for both short-term and long-term traders. The clear entry and exit points defined by these patterns help traders implement disciplined trading strategies, minimizing emotional decision-making and enhancing risk management.
Weaknesses of Using Chart Patterns for Bullish Moves in Forex Trading
Despite their strengths, chart patterns also have weaknesses that traders must consider. One major drawback is the potential for false signals. Market conditions can change rapidly, and patterns that appear promising may fail to materialize as expected, leading to losses. Additionally, these patterns are subjective and can be interpreted differently by different traders, which may result in inconsistent trading outcomes. The reliance on historical data means that patterns may not always account for current market dynamics or unforeseen events that could impact price movements. Moreover, the effectiveness of chart patterns can diminish in highly volatile or low-liquidity markets, where price action can be erratic and less predictable. Therefore, it’s crucial for traders to use chart patterns in conjunction with other technical indicators and fundamental analysis to enhance their trading decisions and reduce the risk of false signals.
Conclusion
Mastering these chart patterns can significantly enhance your ability to identify and capitalize on bullish price moves in the Forex market. By understanding the intricacies of the Double Bottom, Inverse Head and Shoulders, Ascending Triangle, Bullish Flag, Cup and Handle, and Falling Wedge, you can improve your trading decisions and increase your profitability. Always remember to use proper risk management techniques to protect your capital while trading these patterns. Happy trading!
Disclaimer: This is not an Investment Advice. Investing and trading in currencies involve inherent risks. It’s essential to conduct thorough research and consider your risk tolerance before engaging in any financial activities.


