


During the Asian trading session, the USD/JPY pair displayed leadership by driving the USD upwards. It climbed from 145.82 to 146.21 before finding stability. This upward movement was attributed to Japanese importers’ demand, which notably influenced the market action, particularly leading up to the weekend Tokyo fix – a practice where trading desks often try to align their books ahead of the weekend.
This price action was notably supported by the anticipation of a hawkish stance from the Federal Reserve following the Jackson Hole Symposium, a highly anticipated annual economic policy symposium where central bankers and financial leaders gather to discuss global economic trends. Additionally, the persistent strength in US yields contributed to the gains. Notably, the yields on US Treasuries were observed at 5.020% for the 2-year maturity and 4.244% for the 10-year maturity. These yields had reached their peak levels at 5.028% and 4.251% respectively.
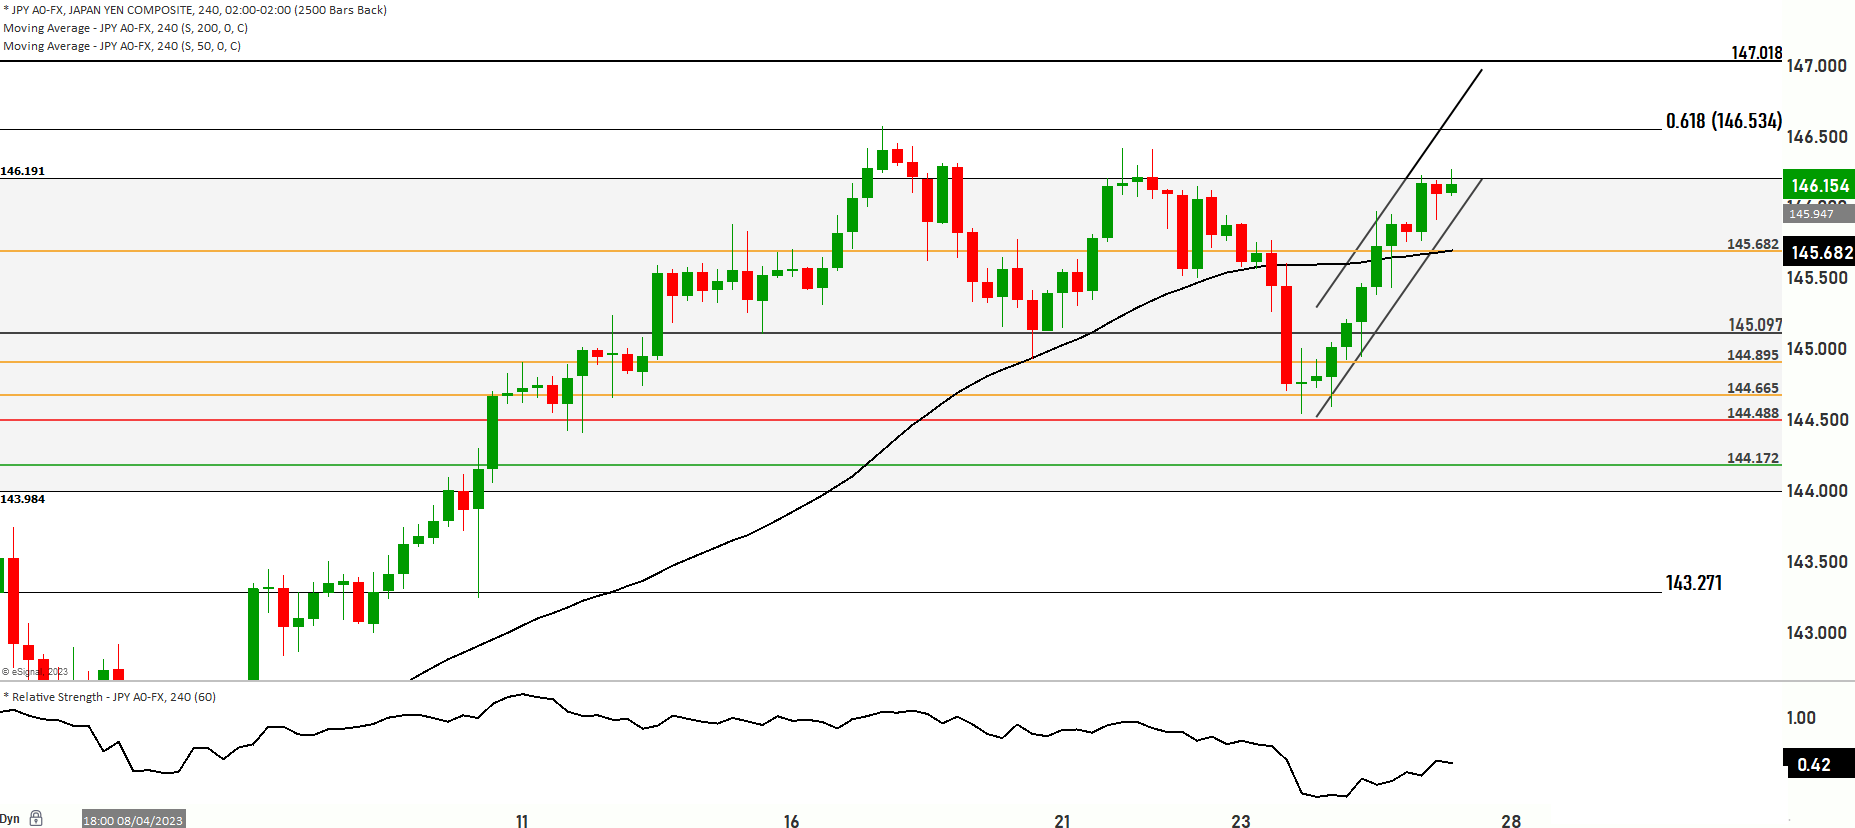
Currently, the USD/JPY currency pair is being traded at the 146.020 level. It’s noteworthy that the prevailing price surpasses both the 200 and 50 Day Moving Averages, which is often interpreted as a sign of bullish momentum in the market.
In the first scenario, there is a possibility that the price might continue its upward movement, targeting a retest of the 146.560 level. Should this bullish trend persist, the price could further advance with the goal of testing the 146.958 level. This particular level aligns with the upper boundary of a resistance range. It’s worth noting that the highest resistance level is positioned at 147.350.
Conversely, the second scenario posits that the price could experience a decline, potentially leading to a test of the 145.682 level. If this test proves successful, it could trigger additional downward movement towards the 144.895 level. There are subsequent support levels to consider in this potential downtrend, namely 144.665 and 142.818, with particular attention to be paid to the 144.488 key level.