
The GBP/USD pair is currently experiencing a range-based bearish trend on its weekly chart, trading with a 0.1% decline near the lower end of a range between 1.2108 and 1.2135 over the course of the day. Despite slightly firmer USD yields in the Asian session, the USD itself has remained relatively unchanged. Recent data showing a decrease in job postings in the UK indicates a cooling labor market, aligning with market expectations that the Bank of England (BoE) will maintain its current interest rates. On the charts, the 5, 10, and 21-day moving averages have been edging lower, and momentum studies are exhibiting a neutral stance. The 21-day Bollinger bands are narrowing, suggesting a modest downside bias, but the overall range still dominates the market. The GBP/USD pair has been consolidating in a broad range between 1.2038 and 1.2337 since October. Initial support can be found at 1.2105 (New York low) and resistance at 1.2135 (Asian high).
Furthermore, GBP/USD faced resistance near the 10-day moving average (DMA) around 1.2160 following a soft rise in US core PCE data. It ended the North American session nearly flat, down 0.06%, at 1.2121, with a range between 1.2163 and 1.2106 during the session. Despite an initial boost from the soft US core PCE data, sterling couldn’t hold onto gains as US Treasury yields rose. Resistance levels for GBP/USD can be found at the 10-DMA (1.2161), 30-DMA (1.2202), and the October 24 high (1.2288). On the downside, support lies at the Friday low of 1.2106, the October 26 low of 1.2020, and the October 4 low/lower 30-day Bollinger Band at 1.2039. The recent competing hammers on October 24 and 25 have been negated, suggesting that the bearish trend remains intact below the 10-DMA. The end of the Fed’s rate hike cycle is seen as no boon for GBP bulls, as the Bank of England is also expected to keep its rates unchanged.
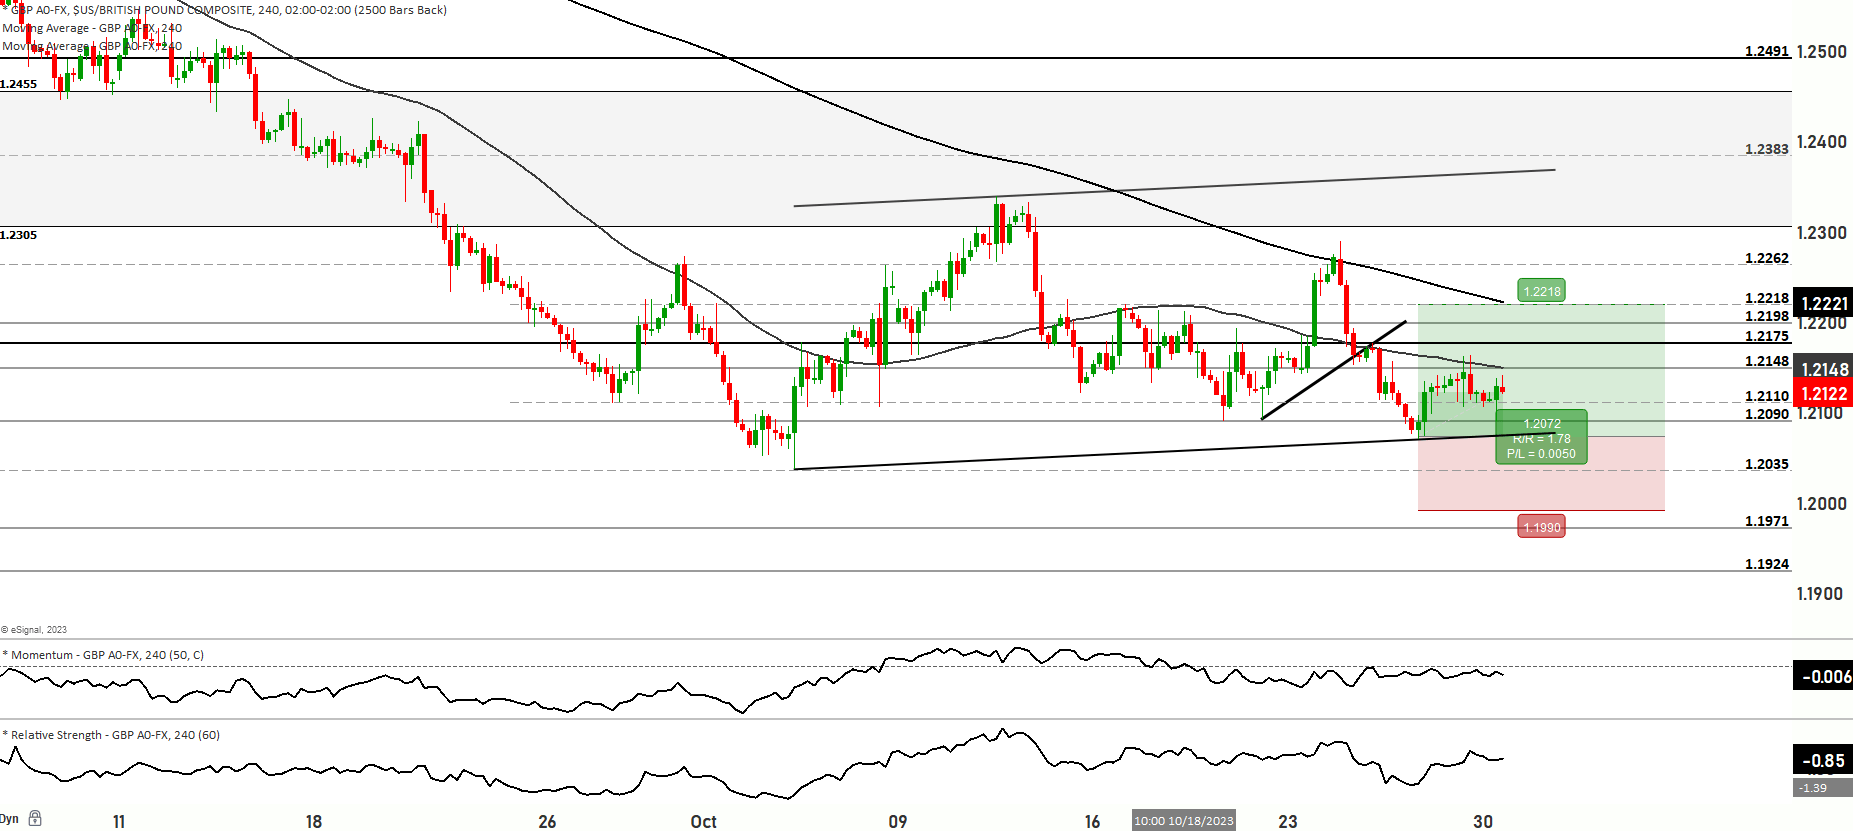
In terms of technical analysis, the GBP/USD pair is currently exhibiting a range-based bearish momentum on the weekly chart. The price is positioned below both the 50 and 200-day moving averages, with the proximity to the 50-day MA suggesting a potential change in direction. Scenario 1 involves a successful retest of the 1.2203 level, potentially leading to further upward movements with resistance at 1.2240, 1.2262, and 1.2280. Scenario 2 envisions a downward move, testing support levels at 1.2085, and if successful, may lead to further declines towards 1.2063, with a significant support level at 1.2085. More bearish momentum could target the 1.2037 to 1.1997 range, with 1.1977 to 1.1920 acting as a major support level. The Relative Strength Index (RSI) is slightly heading towards oversold territory, indicating current downtrend momentum, but it’s important to remain cautious as the market could see a pullback towards bullish sentiment.