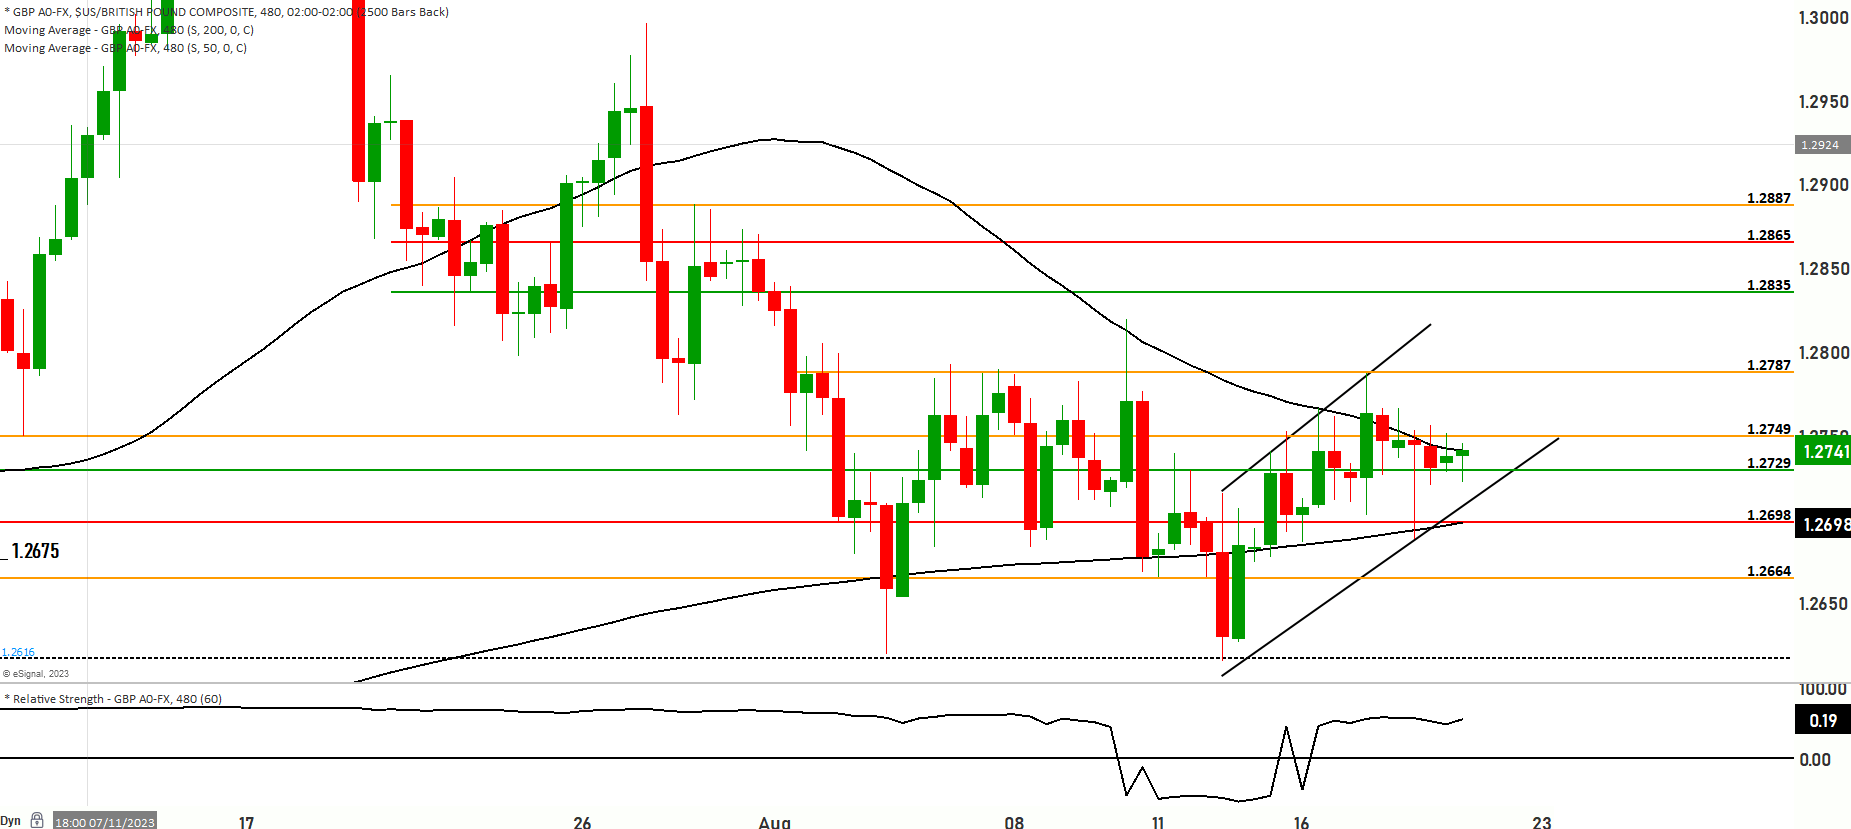
GBP/USD Rangebound with Upside Bias; Break above 1.2787 Needed to Confirm


The GBP/USD pair on the weekly chart is range bound between 1.2735 and 1.2590. The price action is taking place between the 50-day and 200-day simple moving averages, with the 50-day SMA at 1.2715 currently acting as support.
Two possible scenarios can unfold from current levels:
Scenario 1: If the bulls can push the price above 1.2735, which has acted as resistance over the past few weeks, it opens up further upside potential. The next resistance levels to watch will be at 1.2750, 1.2775, 1.2803 and 1.2835. The bulls will need to clear 1.2865, which is the swing high from March, to signal a broader change in trend to the upside.
As long as the price holds above the 50-day SMA at 1.2715, the short-term bias remains bullish. The RSI is approaching overbought territory so some consolidation or minor pullback cannot be ruled out before additional upside. Overall, a decisive break above 1.2735 is needed to confirm resumption of the uptrend.
Scenario 2: Alternatively, if the price breaks below 1.2735, it could signal a resumption of the downtrend. The first support level below is at 1.2673 which is a recent swing low. Below that, the bears will target 1.2654, 1.2637 and the critical support at 1.2615.
If 1.2615 gives way, it opens up a retest of the 2022 lows in the 1.2588-1.2568 area. This range must hold to avoid further downside.
To summarize, the GBP/USD direction in the week ahead depends heavily on the 1.2735 level. A break above signals upside potential while a break below could lead to retest of major support around 1.2590.
Key levels to watch are 1.2673,1.2803, 1.2775,1.2654,1.2835
| Levels | Support | Resistance |
|---|---|---|
| Level 1 | 1.2704 | 1.2775 |
| Level 2 | 1.2673 | 1.2803 |
| Level 3 | 1.2615 | 1.2865 |
