GBP/USD showed strength, rising 0.7% to reach 1.2764 in the New York session, trading within a range of 1.2760 to 1.264 on Tuesday. The pair retreated from the early NY high as traders prepared for upcoming UK CPI and PPI data on Wednesday. This rally was primarily driven by substantial yen selling following a dovish Bank of Japan (BoJ) statement, as the BoJ didn’t provide any clues about its rate path. The dovish tone from the Fed also supported GBP, given the widening UK-US yield spreads. Traders will closely monitor U.S. Q3 GDP and core PCE data on Thursday, as a ‘hot’ reading could potentially reverse recent USD weakness.
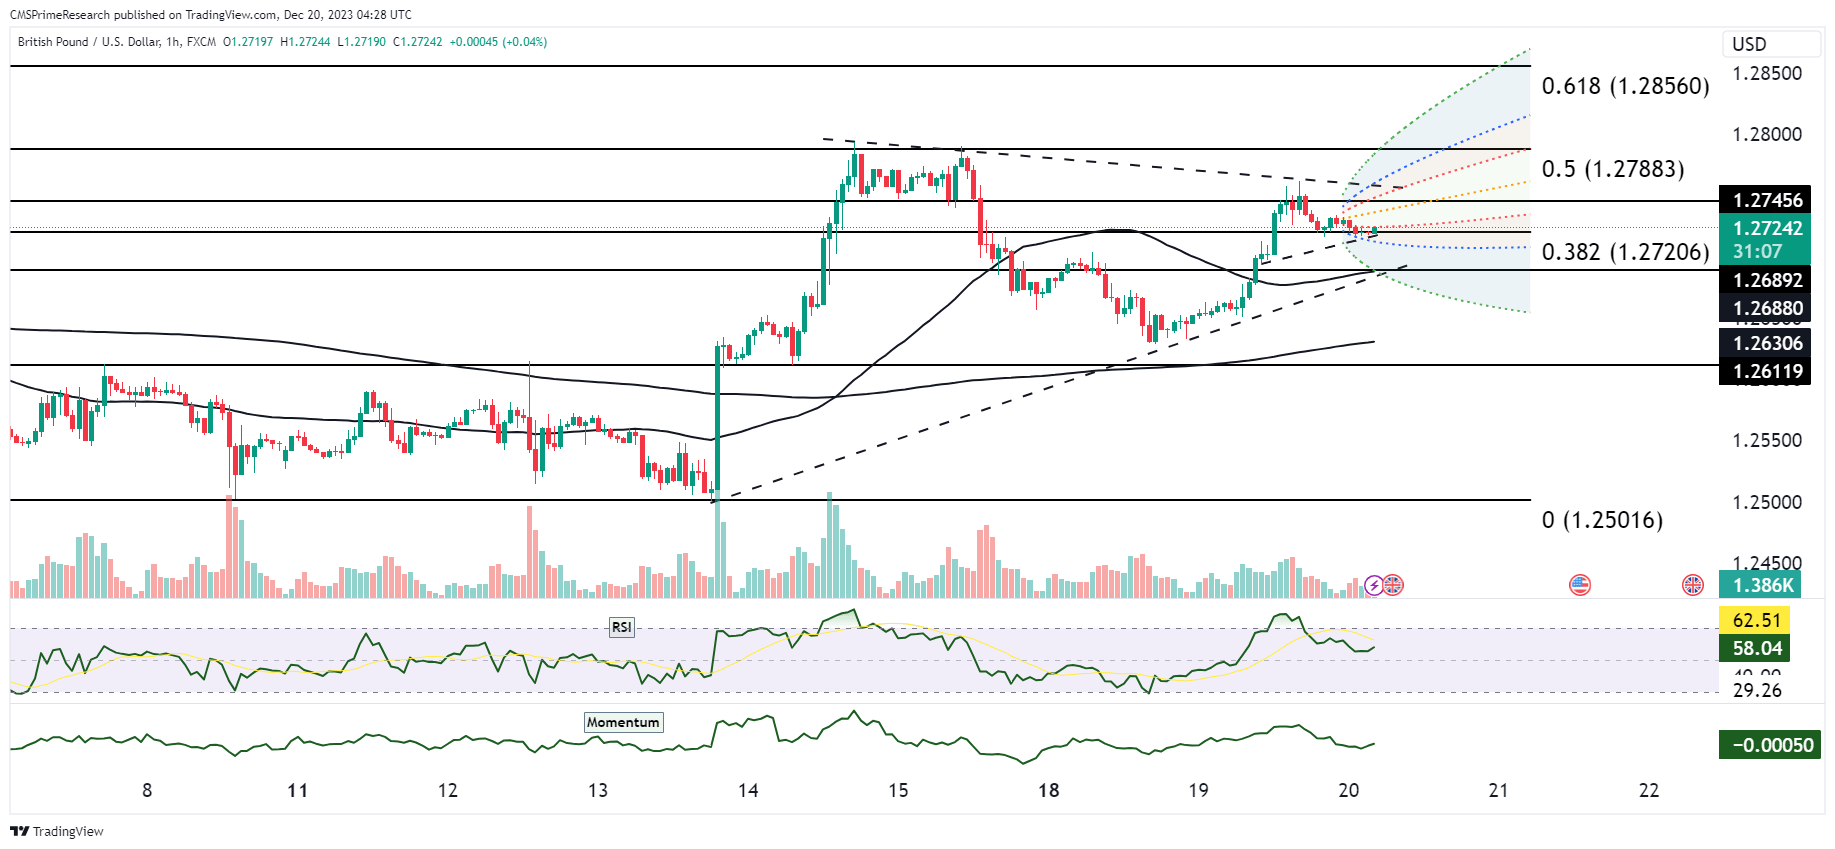
The technical chart for the GBP/USD currency pair presents several critical figures within its analysis. The Fibonacci retracement tool highlights key levels with the 0.382 retracement at 1.27206, the 0.5 at 1.27883, and the 0.618 at 1.28560, which serve as potential support and resistance zones. Currently, the price is positioned at 1.26599, sitting below these levels and suggesting a bearish sentiment. The trading range for this period shows a high of 1.27991 and a low of 1.26548, indicating the pair’s intraday volatility. The Relative Strength Index is moderately bullish with a value of 56.36, but it’s close enough to the neutral threshold to not signify a strong momentum. Conversely, the momentum indicator points to a bearish trend with a reading of -0.00717, indicating a diminishing bullish drive. Lastly, the price has recently crossed below the moving averages, a bearish crossover suggesting that the short-term momentum could be shifting downwards. These numerical insights collectively point towards a potential consolidation phase with a short-term bearish outlook for the GBP/USD pair.