The GBP/USD pair climbed to a session high of 1.2795, potentially setting the stage to test the recent trend high of 1.2818. This upward momentum was primarily fueled by weaker-than-expected U.S. ADP data, indicating that U.S. inflation might be nearing the Federal Reserve’s 2% target faster than previously thought. This could lead to quicker and more substantial rate cuts by the Fed. The U.S. dollar’s weakness was exacerbated by Federal Reserve officials, led by Chair Jerome Powell, signaling that further rate hikes are unlikely. Additionally, stronger-than-expected UK Consumer Price Index (CPI) data and statements from the Bank of England (BoE) pushed expectations for UK rate cuts further into the future. According to LSEG’s IRPR, the odds for a September rate cut are now close to 60%, a notable shift from early May when a June cut seemed likely after the above-forecast UK CPI on May 22. Despite this, GBP/USD seems capped just above 1.28, with the 2024 high at 1.2894 serving as a significant resistance level. However, the recovery of 2024 Fed rate-cut expectations to -46 basis points from -35 basis points in May suggests this resistance could be challenged if upcoming U.S. data continues to disappoint. If U.S. data remains weak, GBP/USD bulls might test recent trend highs, potentially targeting the July 2023 highs around 1.30.
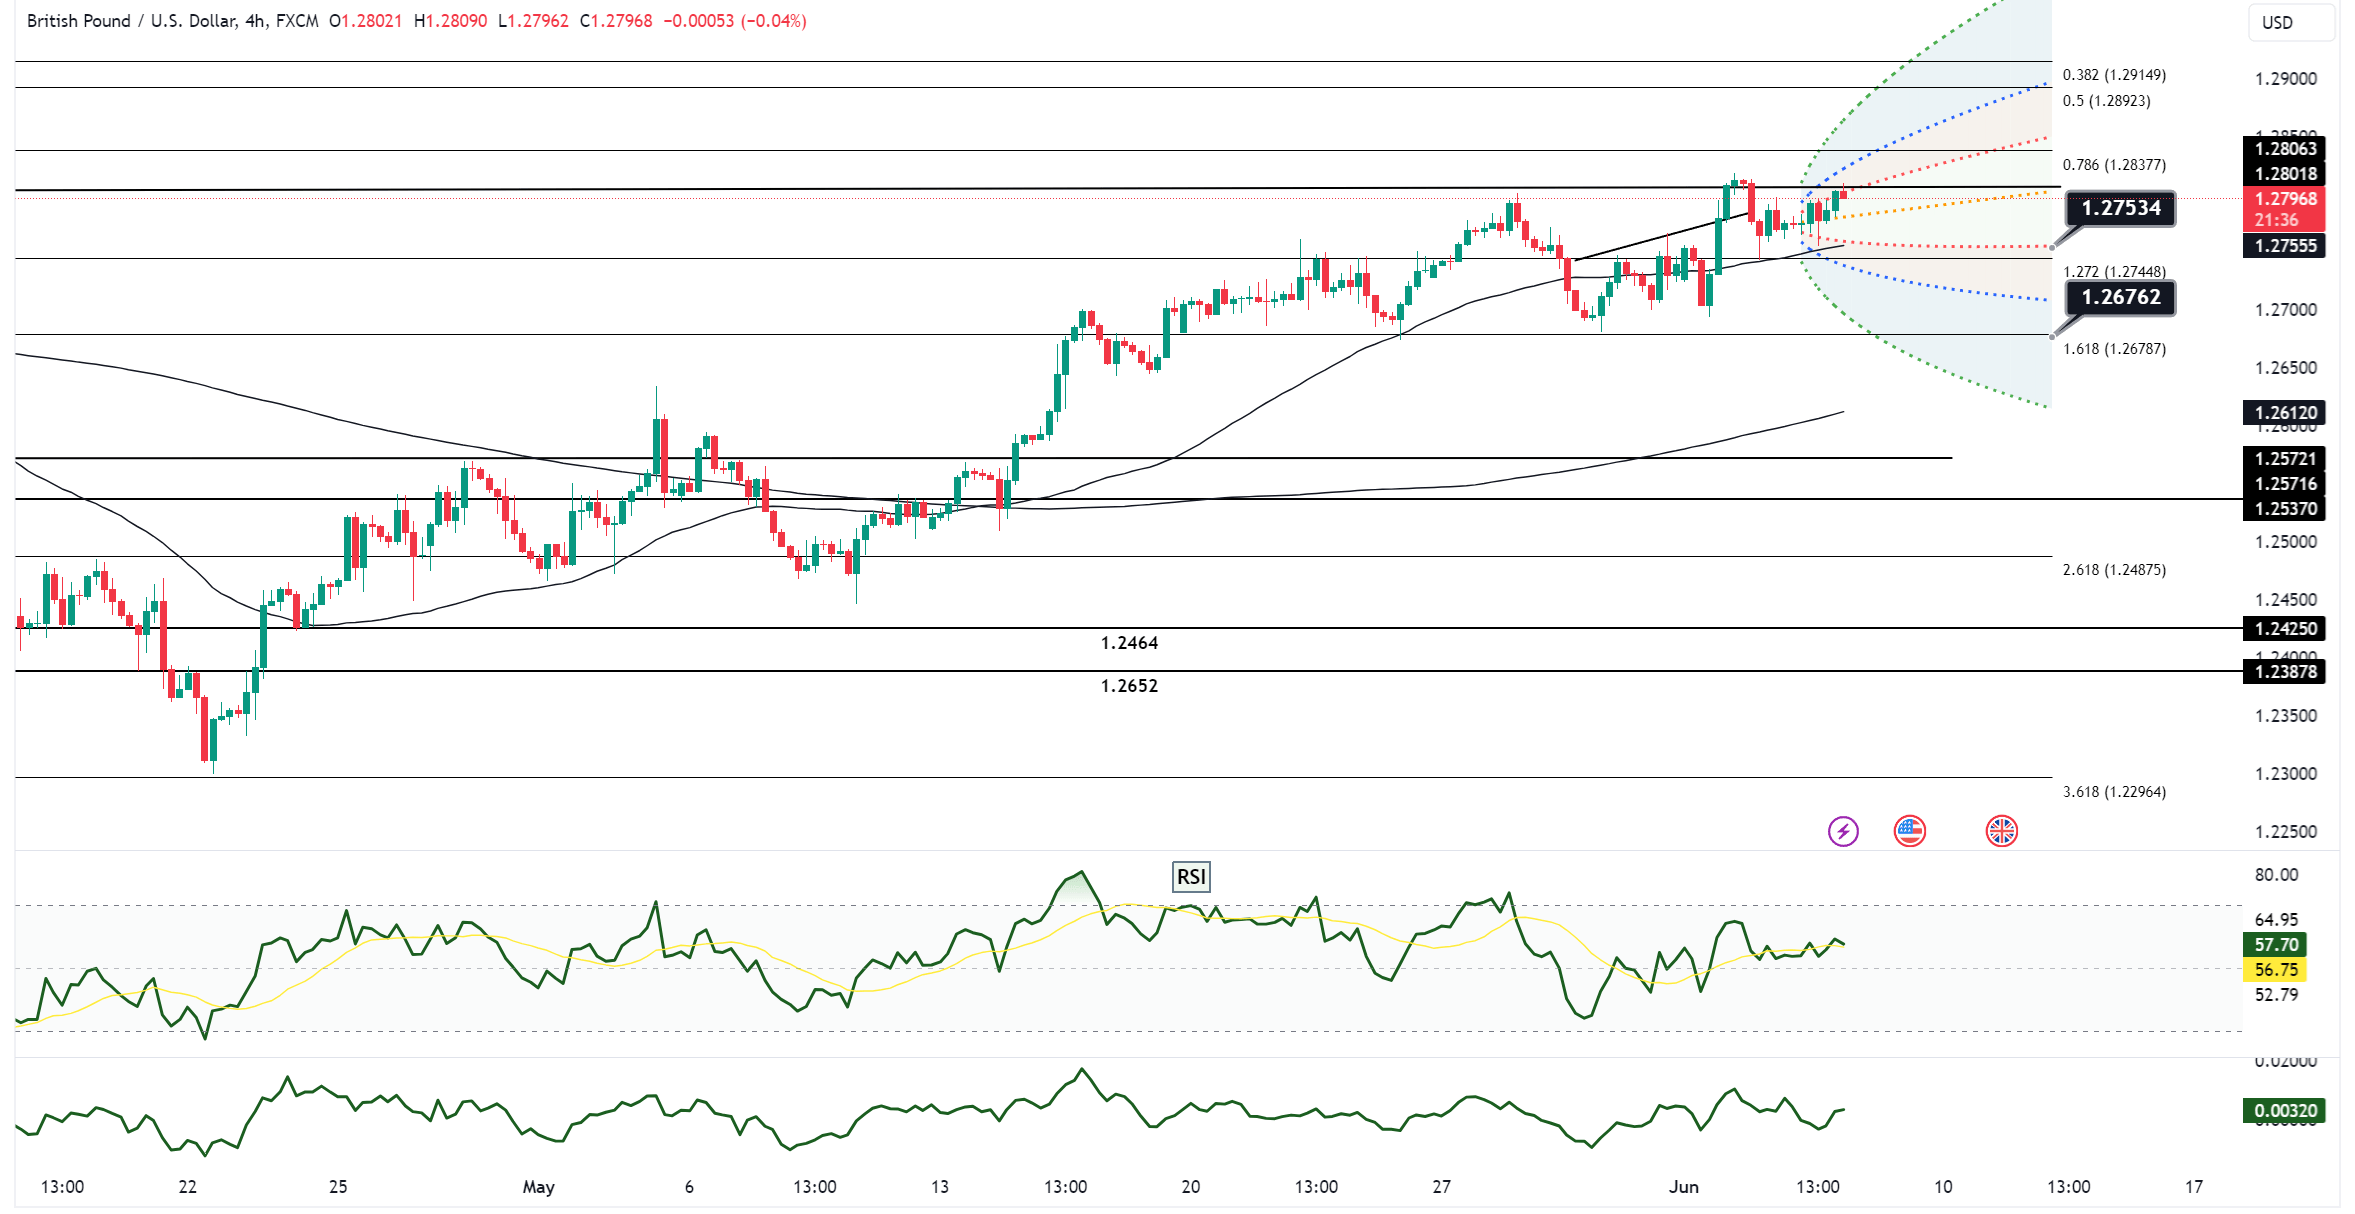
Sterling bulls have retreated from the 1.28 level once more, with the currency holding steady at 1.2772 during the New York afternoon session, trading within a range of 1.2798 to 1.2756 on Wednesday. Resistance at 1.28 held firm following the post-ADP test, as the ISM Non-Manufacturing index exceeded forecasts, prompting a USD bid into the North American close despite a decline in U.S. Treasury yields. Attention now shifts to the upcoming U.S. jobless claims on Thursday and payrolls data on Friday, ahead of the Federal Open Market Committee (FOMC) meeting on June 12. For GBP/USD, immediate resistance levels include Wednesday’s high of 1.2798, the June 4 high of 1.2818, and the year-to-date high of 1.2894 from March 8. On the downside, support is seen around the rising 10-day moving average (DMA) at 1.2750, Tuesday’s low of 1.2743, and the 21-DMA at 1.2685. Sterling traders will closely monitor these levels as they navigate the mixed economic signals and central bank expectations, which continue to drive volatility and trading opportunities in the GBP/USD pair.