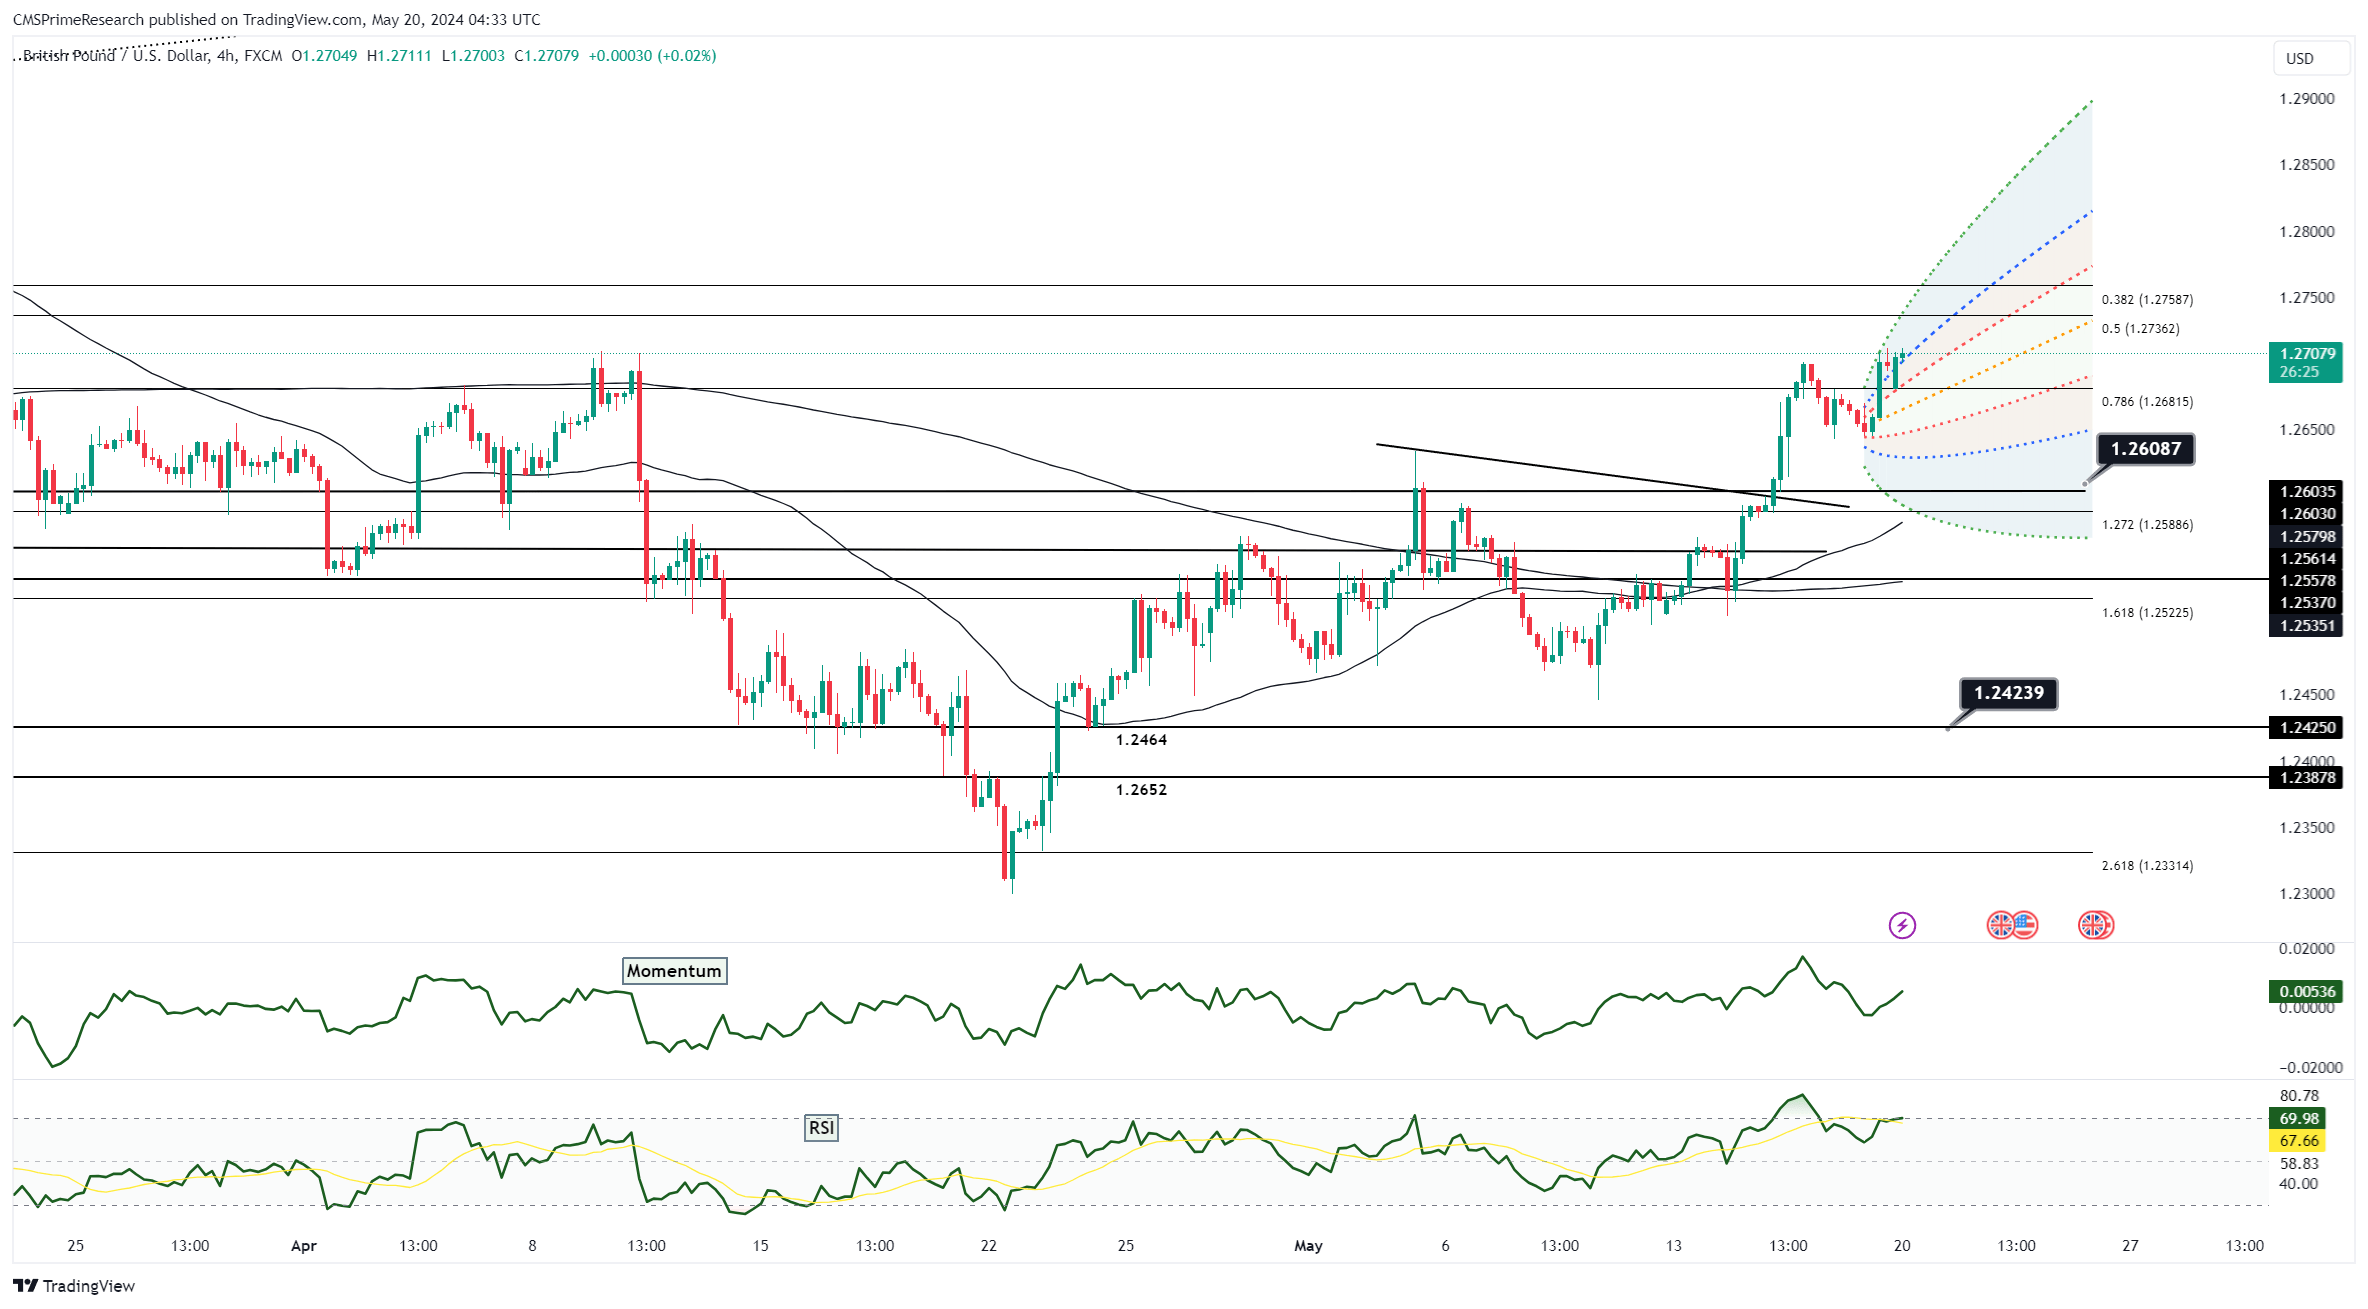
GBP/USD started Monday trading with minimal movement, remaining just below Thursday’s high of 1.27. Traders are assessing the impact of recent U.S. economic data, which includes softer-than-expected CPI figures and surprisingly high import prices. This mix of data has created market uncertainty as investors anticipate the key UK inflation report due next Wednesday. This upcoming report could play a significant role in shaping the Bank of England’s (BoE) policy decisions, potentially leading to a shift towards a more dovish stance in June. Despite holding onto most of the gains from Wednesday’s surge, which saw GBP/USD reach a five-week high, market participants are cautious about testing the 1.2709 peak from April 9-10. The higher U.S. import prices have dampened disinflationary hopes, and dovish comments from MPC member Megan Greene have further fueled expectations of a softer BoE policy.
Technically, GBP/USD faces substantial resistance at the 1.27 level, aligning with the highs from early April. Should the UK inflation data suggest a need for more dovish BoE policies, GBP/USD might test support levels at the 100-day moving average near 1.2632 and the 55-day moving average around 1.2603. A further decline could see the pair targeting the long candle low from Wednesday at 1.2585, and potentially the May 14 low of 1.2510. Fundamentally, the market outlook is heavily dependent on the upcoming UK inflation data. If the report indicates a significant drop in inflation, it would strengthen the argument for a more accommodative BoE policy, likely putting pressure on sterling. Conversely, if inflation remains high, the BoE might be compelled to maintain a more hawkish stance, providing support for GBP/USD. Thus, the interaction between UK inflation figures and BoE policy responses will be critical in determining the near-term direction of the currency pair.