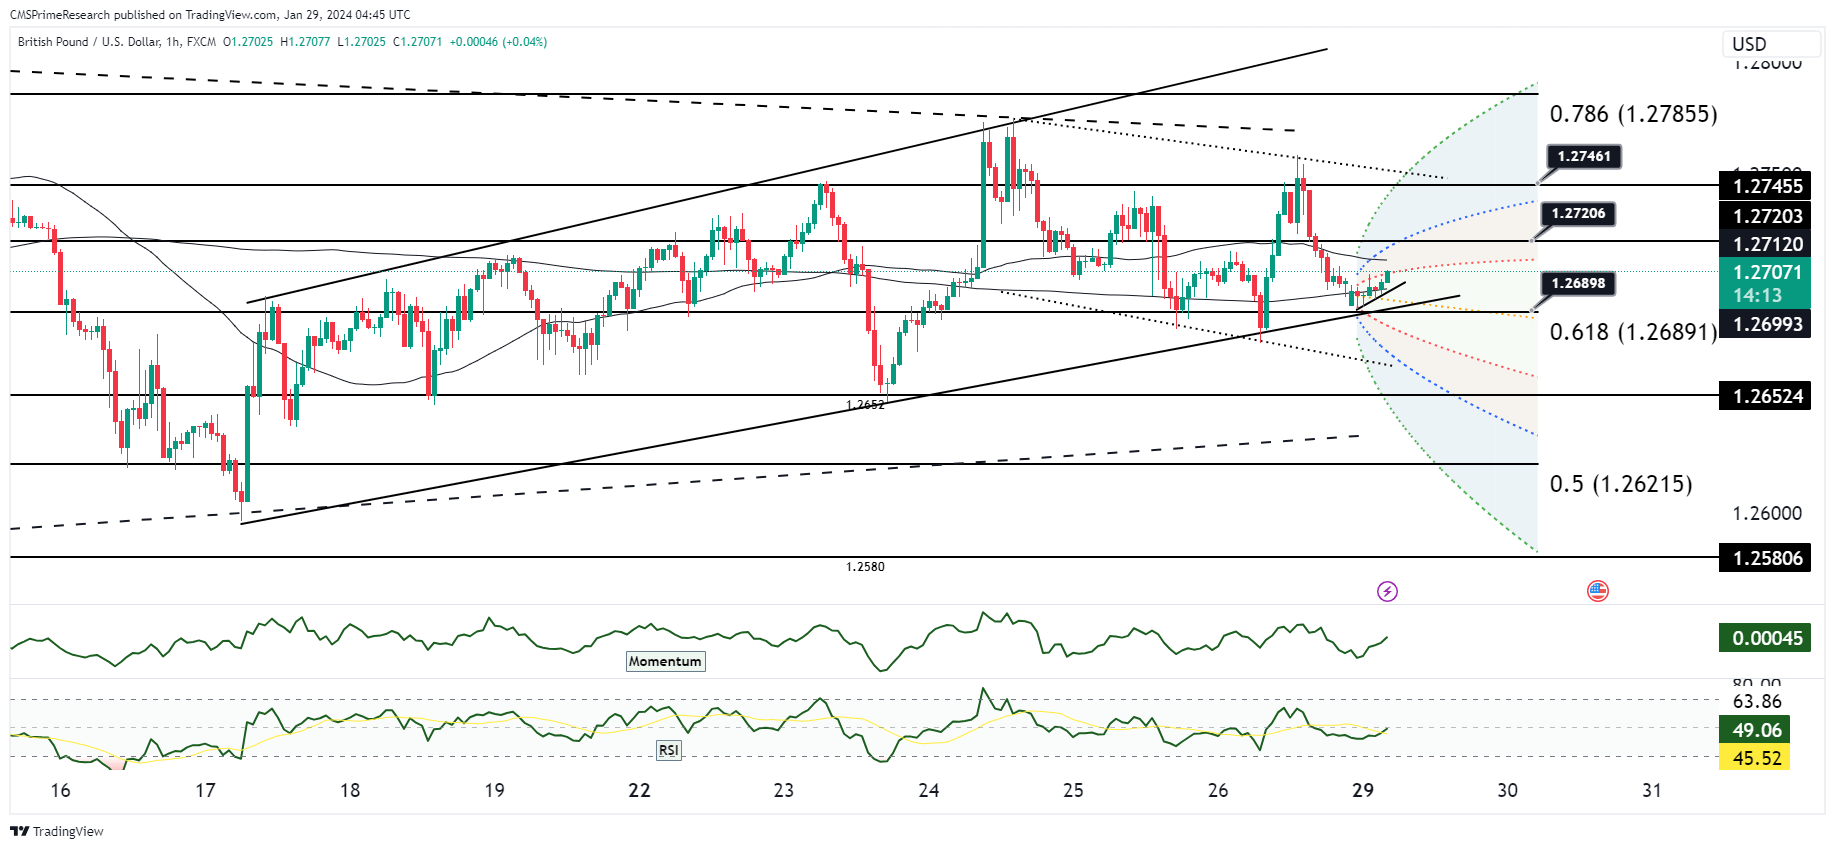
GBP USD bullish, waiting to test the 1.27206 level.

The GBP/USD pair presents a technical conundrum as it navigates through active trading ranges. The technical indicators signal a strong buy, with major moving averages like MA5 and MA10 tilting towards bullish sentiment. However, the presence of a sell signal from the longer-term MA100 and MA200 suggests underlying bearish pressures, indicative of a potential tug-of-war between bulls and bears.
The pair’s recent price action sees it oscillating within the 1.2680/1.2700 range, showing a modest downside bias as indicated by easing daily moving averages and narrowing Bollinger bands. This compression often precedes a breakout. Daily momentum studies suggest the potential for further downside, targeting last week’s low around 1.2645, with the 1.2600 range base looming below as a critical support zone.
On the resistance side, the immediate hurdle lies at 1.2760, followed by last week’s peak at 1.2774. The established seven-week range of 1.2600-1.2800 is poised to be tested, with this week’s event risk possibly providing the catalyst for a decisive move.
The GBP/USD is currently being led by USD dynamics in the absence of significant UK data or Bank of England (BoE) events. The firmer USD, despite upbeat Asian equity markets, hints at a preference for the safety of the dollar, which could cap upside movements in the GBP/USD pair.
The strength of the USD is underpinned by a positive economic outlook, as indicated by the recent performance of the U.S. economy and financial markets. This dynamic often plays against the GBP, especially in times of uncertainty or when the market favors liquidity and security over yield.
Overall Market Sentiment:
The market sentiment for GBP/USD, considering both the technical and fundamental factors, can be quantified as follows:
- Positive Sentiment: 45% – Supported by the strong technical buy signals and the active upper range of trading.
- Negative Sentiment: 35% – Reflecting the firmer USD and the potential for a downturn, underscored by daily momentum studies.
- Neutral Sentiment: 20% – Accounting for the lack of UK data and BoE inputs, which leaves room for the pair to be swayed by external factors.
The sentiment suggests a cautiously optimistic outlook on the GBP/USD, with recognition of the potential for a downside risk. The market is likely waiting for further economic cues to determine the direction of the pair. Upcoming FOMC event and data releases, especially from the U.S., will be crucial in shaping market sentiment and could potentially break the GBP/USD out of its current range. The mixed signals from the technical indicators underscore the importance of being prepared for volatility in both directions.
Key Levels to Watch: : 1.2727,1.2736,1.2745
| Levels | Support | Resistance |
|---|---|---|
| Level 1 | 1.2700 | 1.2721 |
| Level 2 | 1.2690 | 1.2730 |
| Level 3 | 1.2677 | 1.2745 |


