
The GBP/USD currency pair experienced recent developments influenced by economic data and central bank actions. The US core PCE index, a key measure of consumer-focused inflation, fell short of expectations in August, with a 0.1% month-on-month increase, below the anticipated 0.2% and the previous month’s 0.2%. On an annual basis, the index decreased to 3.9% from 4.3%, aligning with expectations. This outcome led to a decline in the US dollar as US bond yields slowed, and expectations of another federal interest rate hike in 2023 diminished. The Federal Reserve’s preferred inflation measure, the core personal consumption expenditures deflator, exhibited its slowest rate of increase since November 2020.
Furthermore, consumer spending in the United States grew by 0.4% in August, slightly below consensus expectations of a 0.5% increase and lower than the previous month’s 0.8% rise. Real spending increased by 0.1% during the same period, primarily driven by higher energy prices. US personal income also slightly missed consensus expectations at 0.4%. Despite the US dollar initially strengthening following the Federal Reserve’s policy announcement, which indicated an expected rate increase in 2023 and greater caution regarding interest rate cuts in 2024, concerns over persistent inflation remained. Personal consumption expenditure figures suggest that these concerns, while not disappearing entirely, can be somewhat alleviated.
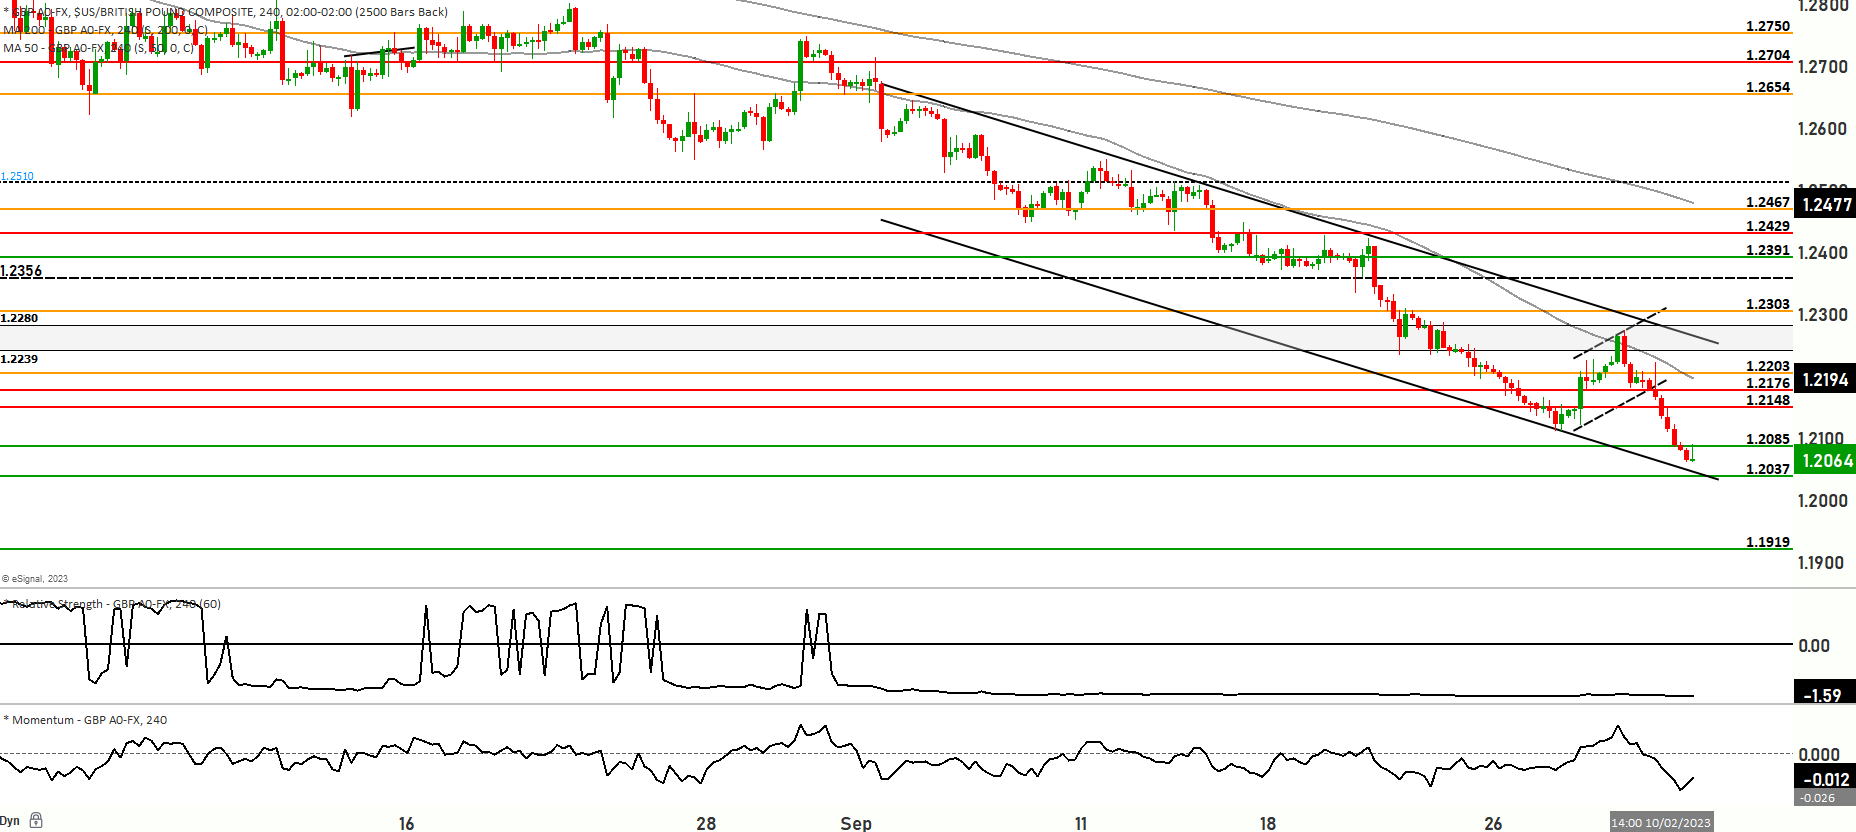
In the context of technical analysis, the GBP/USD pair is currently in a short-term bearish downtrend, testing support levels at 1.2065. The pair is trading below both the 200-day and 50-day moving averages, indicative of a bearish market sentiment. In Scenario 1, the price may continue to rise, testing the 1.2148 level and potentially advancing further to levels around 1.2178. Continued bullish momentum could lead to a test of the topmost resistance at 1.2228. On the other hand, in Scenario 2, the price might decline from its current levels, seeking support at 1.2037, with a potential further drop towards 1.1994. If these levels fail to hold, the price could descend to test 1.1920 and 1.1850, with 1.1802 serving as a significant support level. Short-term momentum for the pair is currently in a bearish zone, with the Relative Strength Index (RSI) indicating oversold conditions. The market’s likely trading range extends between 1.1800 and 1.2228 levels, and close attention should be paid to price reactions within this range. The RSI signals a prevailing bearish bias in the market.