


In the GBP USD 240 Minute Chart Analysis, the pair has been exhibiting a distinct short-term bearish downtrend. Presently, the pair is diligently testing the support levels situated at 1.2680. This testing of the support level comes concurrent with the pair’s position below both the 200-day and 50-day moving averages, a clear indication of a prevailing bearish sentiment.
It’s noteworthy to mention that a slight pullback was observed subsequent to yesterday’s lows, recorded at 1.2615. This upswing, however modest, is significant as it introduces two potential scenarios that could shape the trajectory of the pair’s movement.
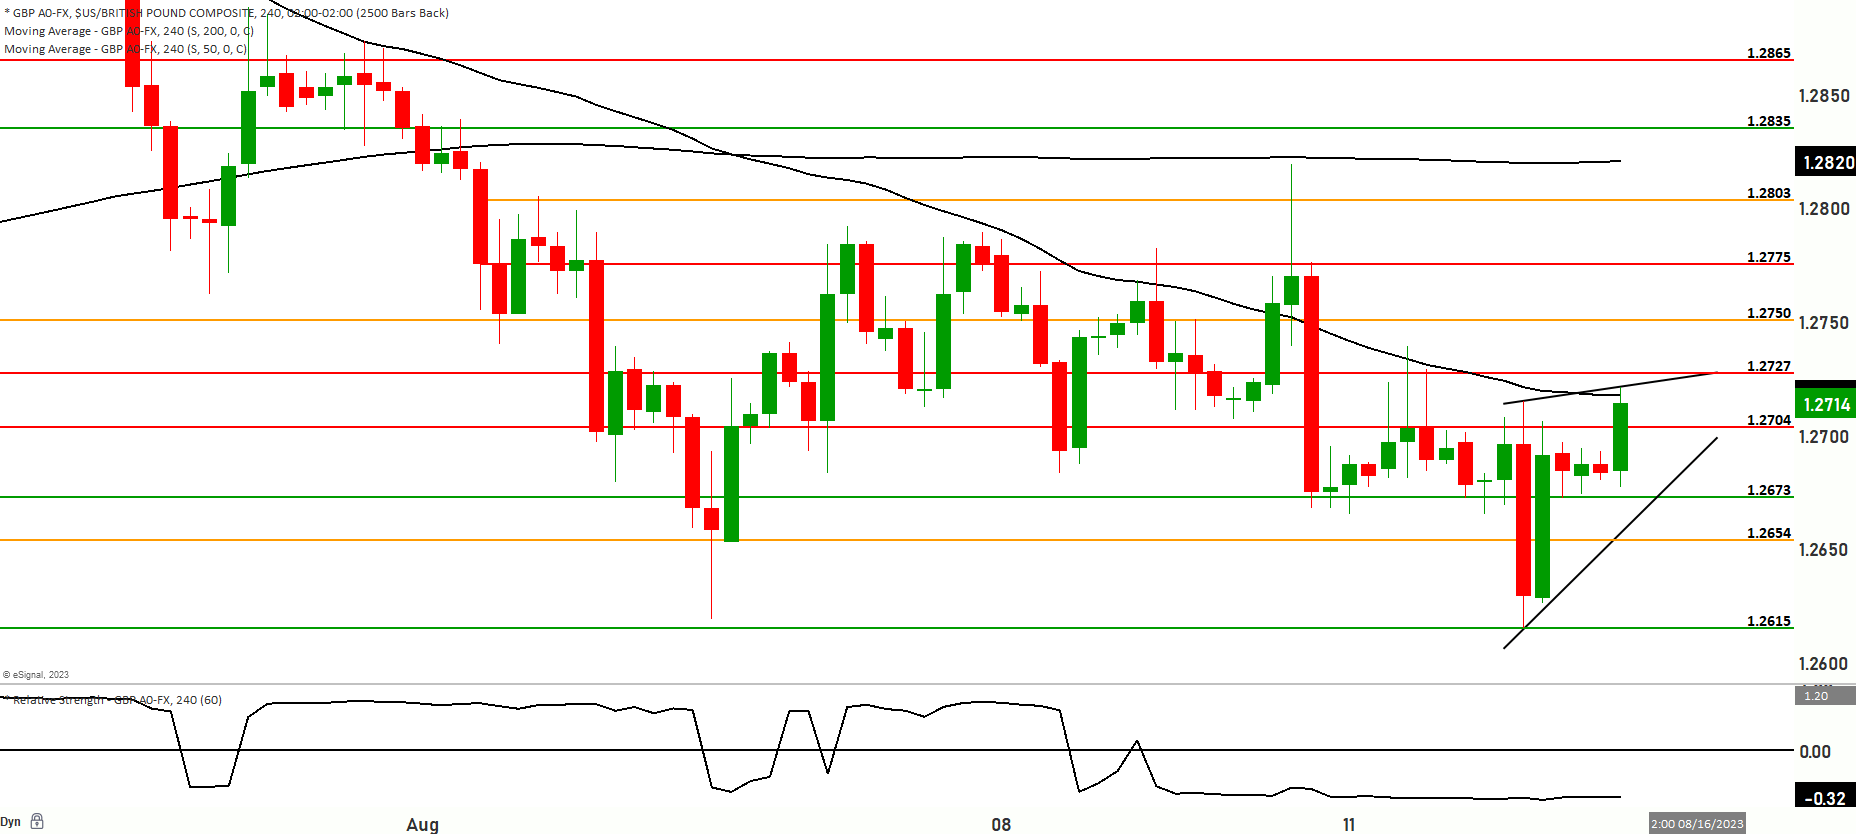
Scenario 1: Potential Upside Movement
Should the current momentum persist, there is potential for the price to ascend further, subsequently challenging the resistance levels within the range of 1.2704 to 1.2727. Progress beyond this juncture could propel the pair into the upper echelons, specifically the range spanning from 1.2750 to 1.2775. Further bullish momentum may even lead to a thorough examination of the 1.2803 level, the paramount resistance point.
Scenario 2: Potential Downside Correction
On the other hand, there exists the plausible outcome of a downward correction from the present levels. Such a correction might find support around the 1.2654 level, and if that holds, it could establish a foothold for the price, potentially stabilizing it near 1.2642. However, should this lower level not prove to be a sufficiently robust support, a further descent might transpire, pushing the pair to scrutinize the 1.2631 and ultimately the 1.2615 levels. It’s imperative to underline that the 1.2615 level holds considerable importance as a major support level.
Presently, the short-term momentum of the GBP/USD pair hovers at the intersection between upward movement and bearish territory. The Relative Strength Index (RSI), a key technical indicator, has ventured into oversold conditions, indicating a potential turning point.In terms of broader market movement, the GBP/USD pair seems poised to trade within the confines of the 1.2847 to 1.2590 level range. The forthcoming market behavior will be critical to observe at these pivotal thresholds. This observation is complemented by the pair’s consistent consolidation within the 1.2680 to 1.2711 range, which while seemingly stable, hints at an underlying downward trend.
Market anticipation is notably centered around upcoming UK job data, which is projected to reflect a 4% unemployment rate and a positive jobs change of +75K. These figures carry the potential to reinforce the recent positive data emanating from the UK, with possible ramifications for interest rates.
Additionally, the contraction of the 21-day Bollinger Bands, along with the gradual decline of the 5, 10, and 21-day moving averages, collectively signal an impending downside risk.