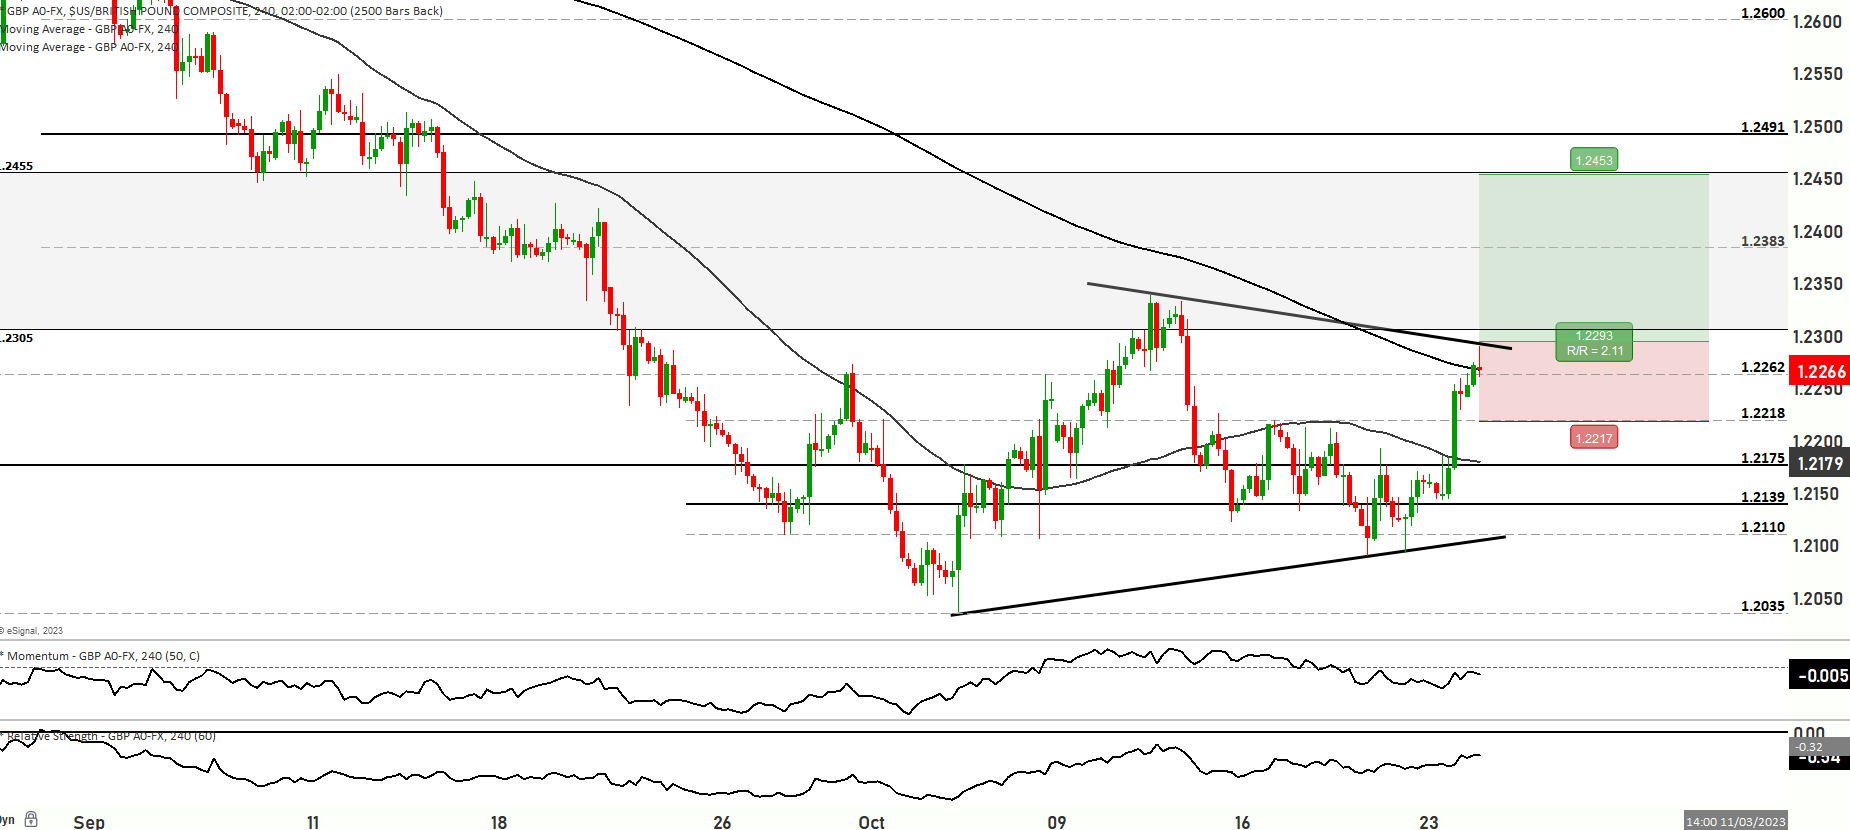
GBP/USD turns slightly bullish after key UK employment reports, Heading to retest the September Range from 1.2305 to 1.2455


The GBP/USD pair is currently experiencing increased bullish activity as it trades within a short-term range, with its current testing level at 1.2265. The price is positioned just above both the 200 and 50-day moving averages, suggesting a slightly bullish sentiment in the market.
In the first scenario, the price may continue its upward movement, testing levels like 1.2280, 1.2331, and potentially reaching the upper levels near 1.2356. Further bullish momentum could even drive the price to test the highest resistance level at 1.2391.
Conversely, in the second scenario, the price could decline from its current levels. It may find support at the 1.2203 and 1.2176 levels, with prices hovering near 1.2148. If this level doesn’t hold, further downward movement could push the price to test the 1.2085 level, which serves as significant support.
At present, the short-term momentum for the pair falls close to the bullish territory but within a range. The Relative Strength Index (RSI) indicates a tendency towards the overbought zone. The market may fluctuate between the levels of 1.2035 to 1.2348, and closely observing price reactions at these levels will be essential. The Relative Strength Indicator suggests a bearish range bias for the market, underscoring the need for cautious trading.
Overall, the GBP/USD pair remains influenced by various factors, including upcoming economic events and shifts in U.S. Treasury yields, which can affect its short-term direction and trading range.
Key Levels to watch are 1.2148,1.2280,1.2303,1.2303,1.2391
| Levels | Support | Resistance |
|---|---|---|
| Level 1 | 1.2203 | 1.2303 |
| Level 2 | 1.2176 | 1.2348 |
| Level 3 | 1.2148 | 1.2391 |


