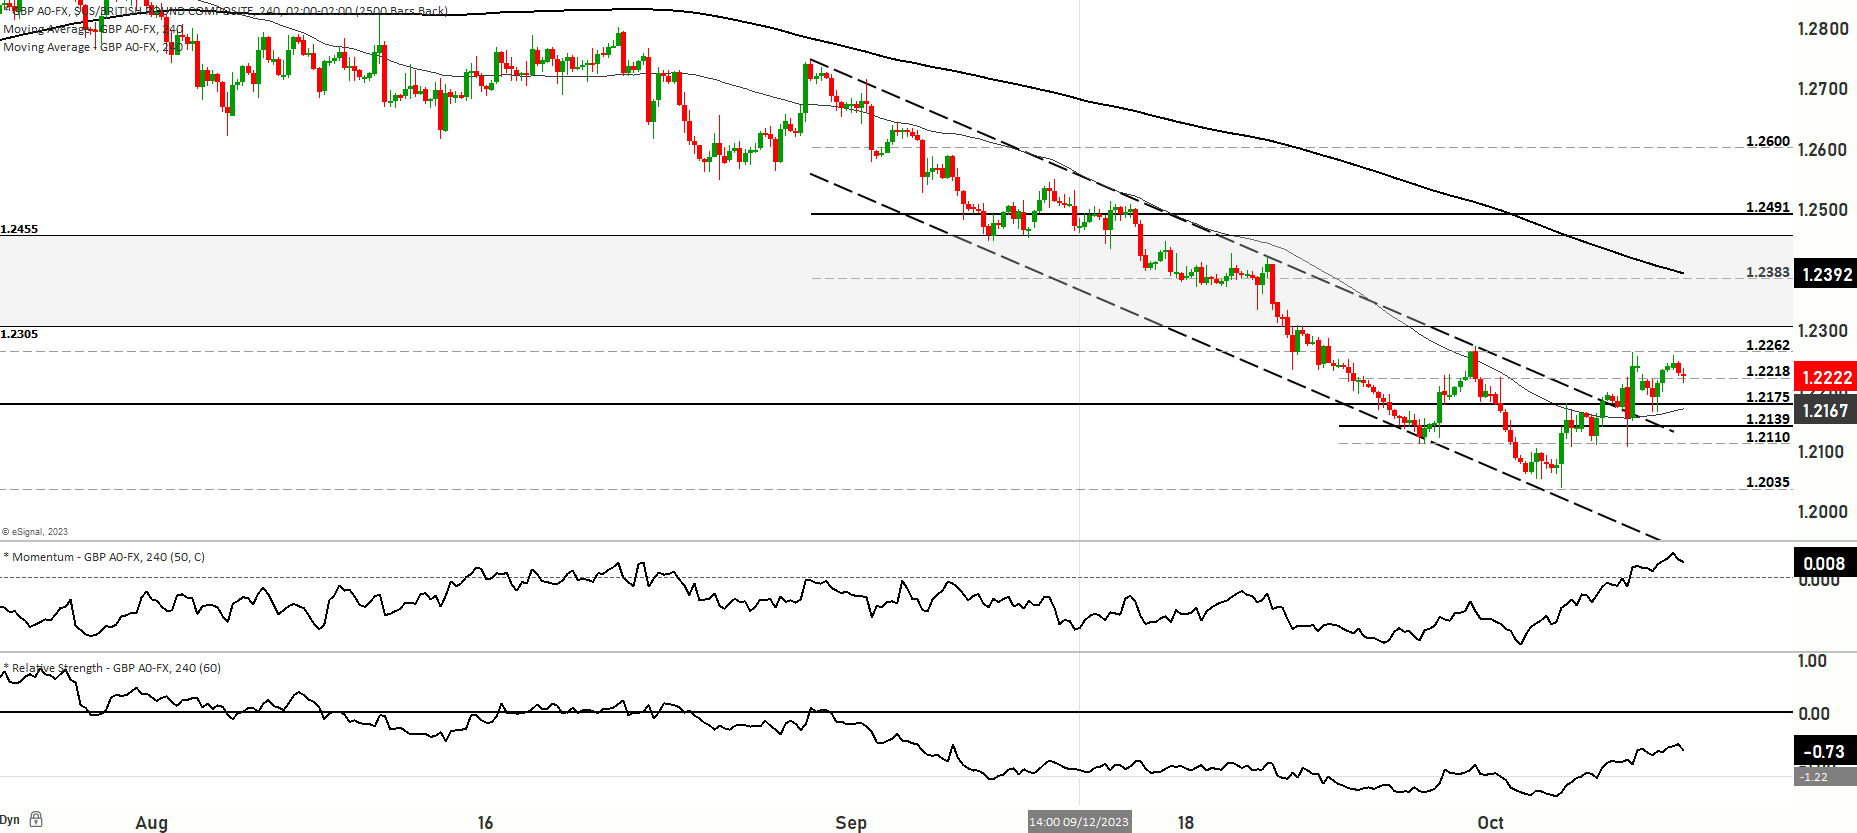
GBP USD short term bullish, but long term trend remains to the downside, key level to monitor is a test to the 1.2262 level


The GBP/USD pair has exhibited a blend of nuanced behaviors amid geopolitical strife and economic indications. Observing the 4-hour chart, the Relative Strength Index (RSI) commendably sustains above 50, even amidst the recent decrement. A pivotal resistance coexists at 1.2200, interweaving the psychological level and the Fibonacci 23.6% retracement of the preceding downtrend. If the pair sustains below this juncture, ensuing checkpoints of 1.2150 (a 50-period Simple Moving Average), 1.2120 (the apex of a formerly ruptured descending regression channel), and 1.2100 (another psychological level and static level) may witness testing.
Escalating above and stabilizing at 1.2200 propels 1.2230 (100-period Simple Moving Average) into focus, possibly acting as formidable resistance before 1.2250 (static level). Markedly, GBP/USD concluded the antecedent week nearly static, despite a robust rebound during the week’s latter half. The initial phase of the new week unfolded with a bearish gap below 1.2200, propelled by a marked flight to safety, evidently stimulated by Middle Eastern tensions, particularly involving Israel, Hamas, and subsequent U.S. retaliatory measures.
In the economic dimension, the U.S. Dollar (USD) capitalizes on safe-haven flows, propelling the USD Index above 106.50 and marking a 0.4% day-on-day ascension, counterbalancing a near 1% three-day descent last week. With U.S. bond markets idling on Monday for Columbus Day, albeit with stock markets maintaining regular hours, Wall Street’s primary indexes may notably impact USD valuation. Any bearishness in U.S. stocks could consolidate USD’s strength during the American session.
Meanwhile, Michelle Bowman, a Federal Reserve Governor, proffered that a requisite for additional and prolonged monetary policy tightening is impending to recalibrate inflation towards the 2% target. This narrative sets a complex backdrop for GBP/USD, currently navigating a short-term bullish trend and testing support levels at 1.2230, marginally above the 200 and 50-day moving averages, signifying a bullish range market.
Evaluating forthcoming trajectories, Scenario 1 postulates an ascent to potentially test the 1.2280 level, with a further bullish surge possibly interrogating 1.2303 and even peaking at 1.2334, the ultimate resistance. Contrarily, Scenario 2 contemplates a retraction from current values, engaging supports at 1.2203 and 1.2176, and potentially even 1.2148. Failure to uphold this level could initiate a descent towards 1.2125 and 1.2085, recognizing 1.2063 as a significant support bracket. Presently, short-term momentum borders on bullish territory, albeit within range, with the RSI verging on an overbought zone. With the market possibly oscillating between 1.2037 and 1.2303, attention to price reactions at these tiers is advised, especially as the RSI intimates a bearish range bias.
Key Levels to watch are 1.2120,1.2148,1.2205,1.2000,1.1920,1.2280,1.2303
| Levels | Support | Resistance |
|---|---|---|
| Level 1 | 1.2203 | 1.2280 |
| Level 2 | 1.2176 | 1.2303 |
| Level 3 | 1.2146 | 1.2335 |


