


EUR/USD Bear Control Below 1.16: Anatomy of a DownMove
EUR USD Bear Control Below 1.16: Anatomy of a DownMove
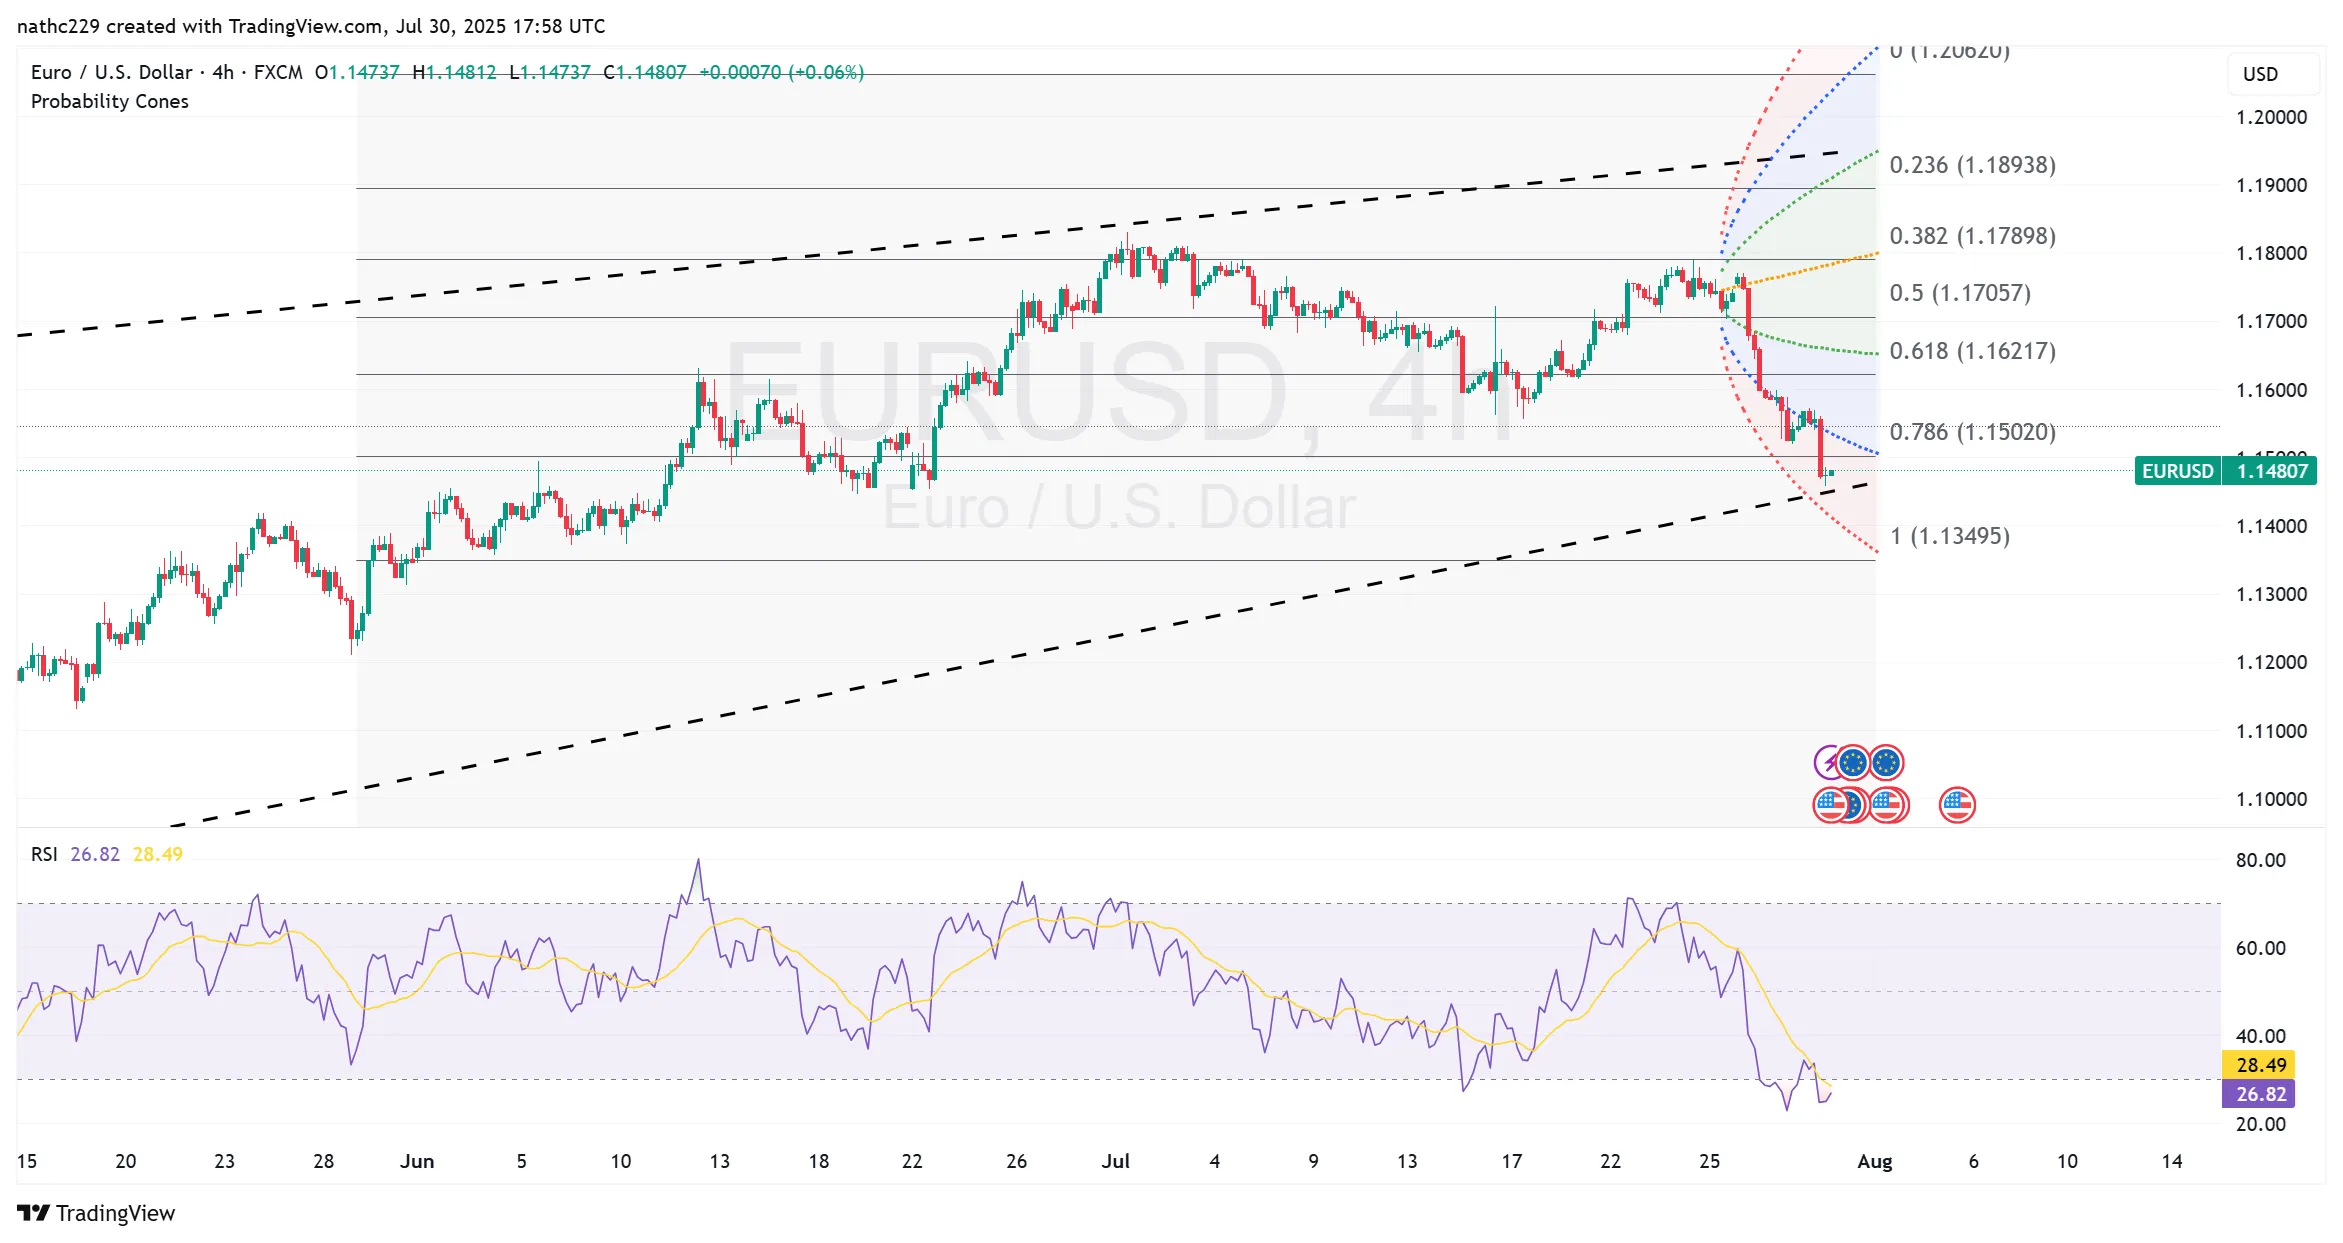
Context and Price Structure
The euro has posted five straight daily losses, falling from 1.1800 on 24 July to a low of 1.1518 on the Fedday European morning, erasing its entire July advance . The slide accelerated once the pair sliced beneath its 50day simple moving average (now 1.1625) on 28 July and then cracked the 100day SMA at 1.1580 the following session, marking a clean shift from neutral to bearish territory
Key Levels and Trendlines
Immediate resistance: 1.15801.1625 zone (cluster of the 100day SMA, a descending trendline from the 1.1834 July high, and the 23.6 % Fibonacci retracement of the May–July rally)
Primary support: 1.1500/1.1480 (June swing low, roundnumber psychology, and the neckline of a potential doubletop structure traced between 1.1830 and 1.18) .
Secondary targets: 1.1430 (38.2 % Fib of the JanuaryJuly upmove) and 1.1370 (December 2024 highvolume node)
A daily close below 1.1500 would complete a fiveweek headandshoulders top, projecting toward 1.1300 in measuredmove terms
Momentum and Oscillators
The 14day RSI broke its midpoint at 50 on 26 July and now sits at 41, signaling bearish momentum with room to run before reaching oversold extremes. MACD lines crossed negative on 29 July, confirming downside acceleration. Fourhour stochastic oscillators are embedded below 20, suggesting shorterterm exhaustion but not the end of the trend.
MovingAverage Alignment
All watched EMAs slope lower on the fourhour chart: price is below the 20, 50, and 100period MAs, while the 200period rests near 1.1610—well overhead and turning down. Such full “bear alignment” historically precedes multifigure declines.
Volume & Positioning
CFTC data show speculators still netlong euros by roughly 65 k contracts, only marginally trimmed despite the recent drawdown, highlighting capitulation risk if 1.15 breaks decisively
Pattern Diagnostics
Price carved an accelerated downchannel from 1.1800; the lower boundary intersects 1.1480 on Fedday and 1.1430 by early August, guiding potential cascade points. A bullish divergence is absent, reinforcing continuation bias.
EventRisk Overlay
Tariffdeadline headlines on 12 August and U.S. payrolls on 2 August could supply catalysts. Soft labor data might spark a relief bounce, yet any tariff flareup would likely cement a sub1.15 trajectory
Trading Implications
Shorts initiated on intraday bounces toward 1.1580/1.1600 carry attractive riskreward, targeting 1.1430 with stops above 1.1660 (channel break). Only a daily close back over 1.1700 would neutralize the bearish script.