EUR/USD Technical Analysis: Consolidation Phase Continues Amid Bullish Momentum

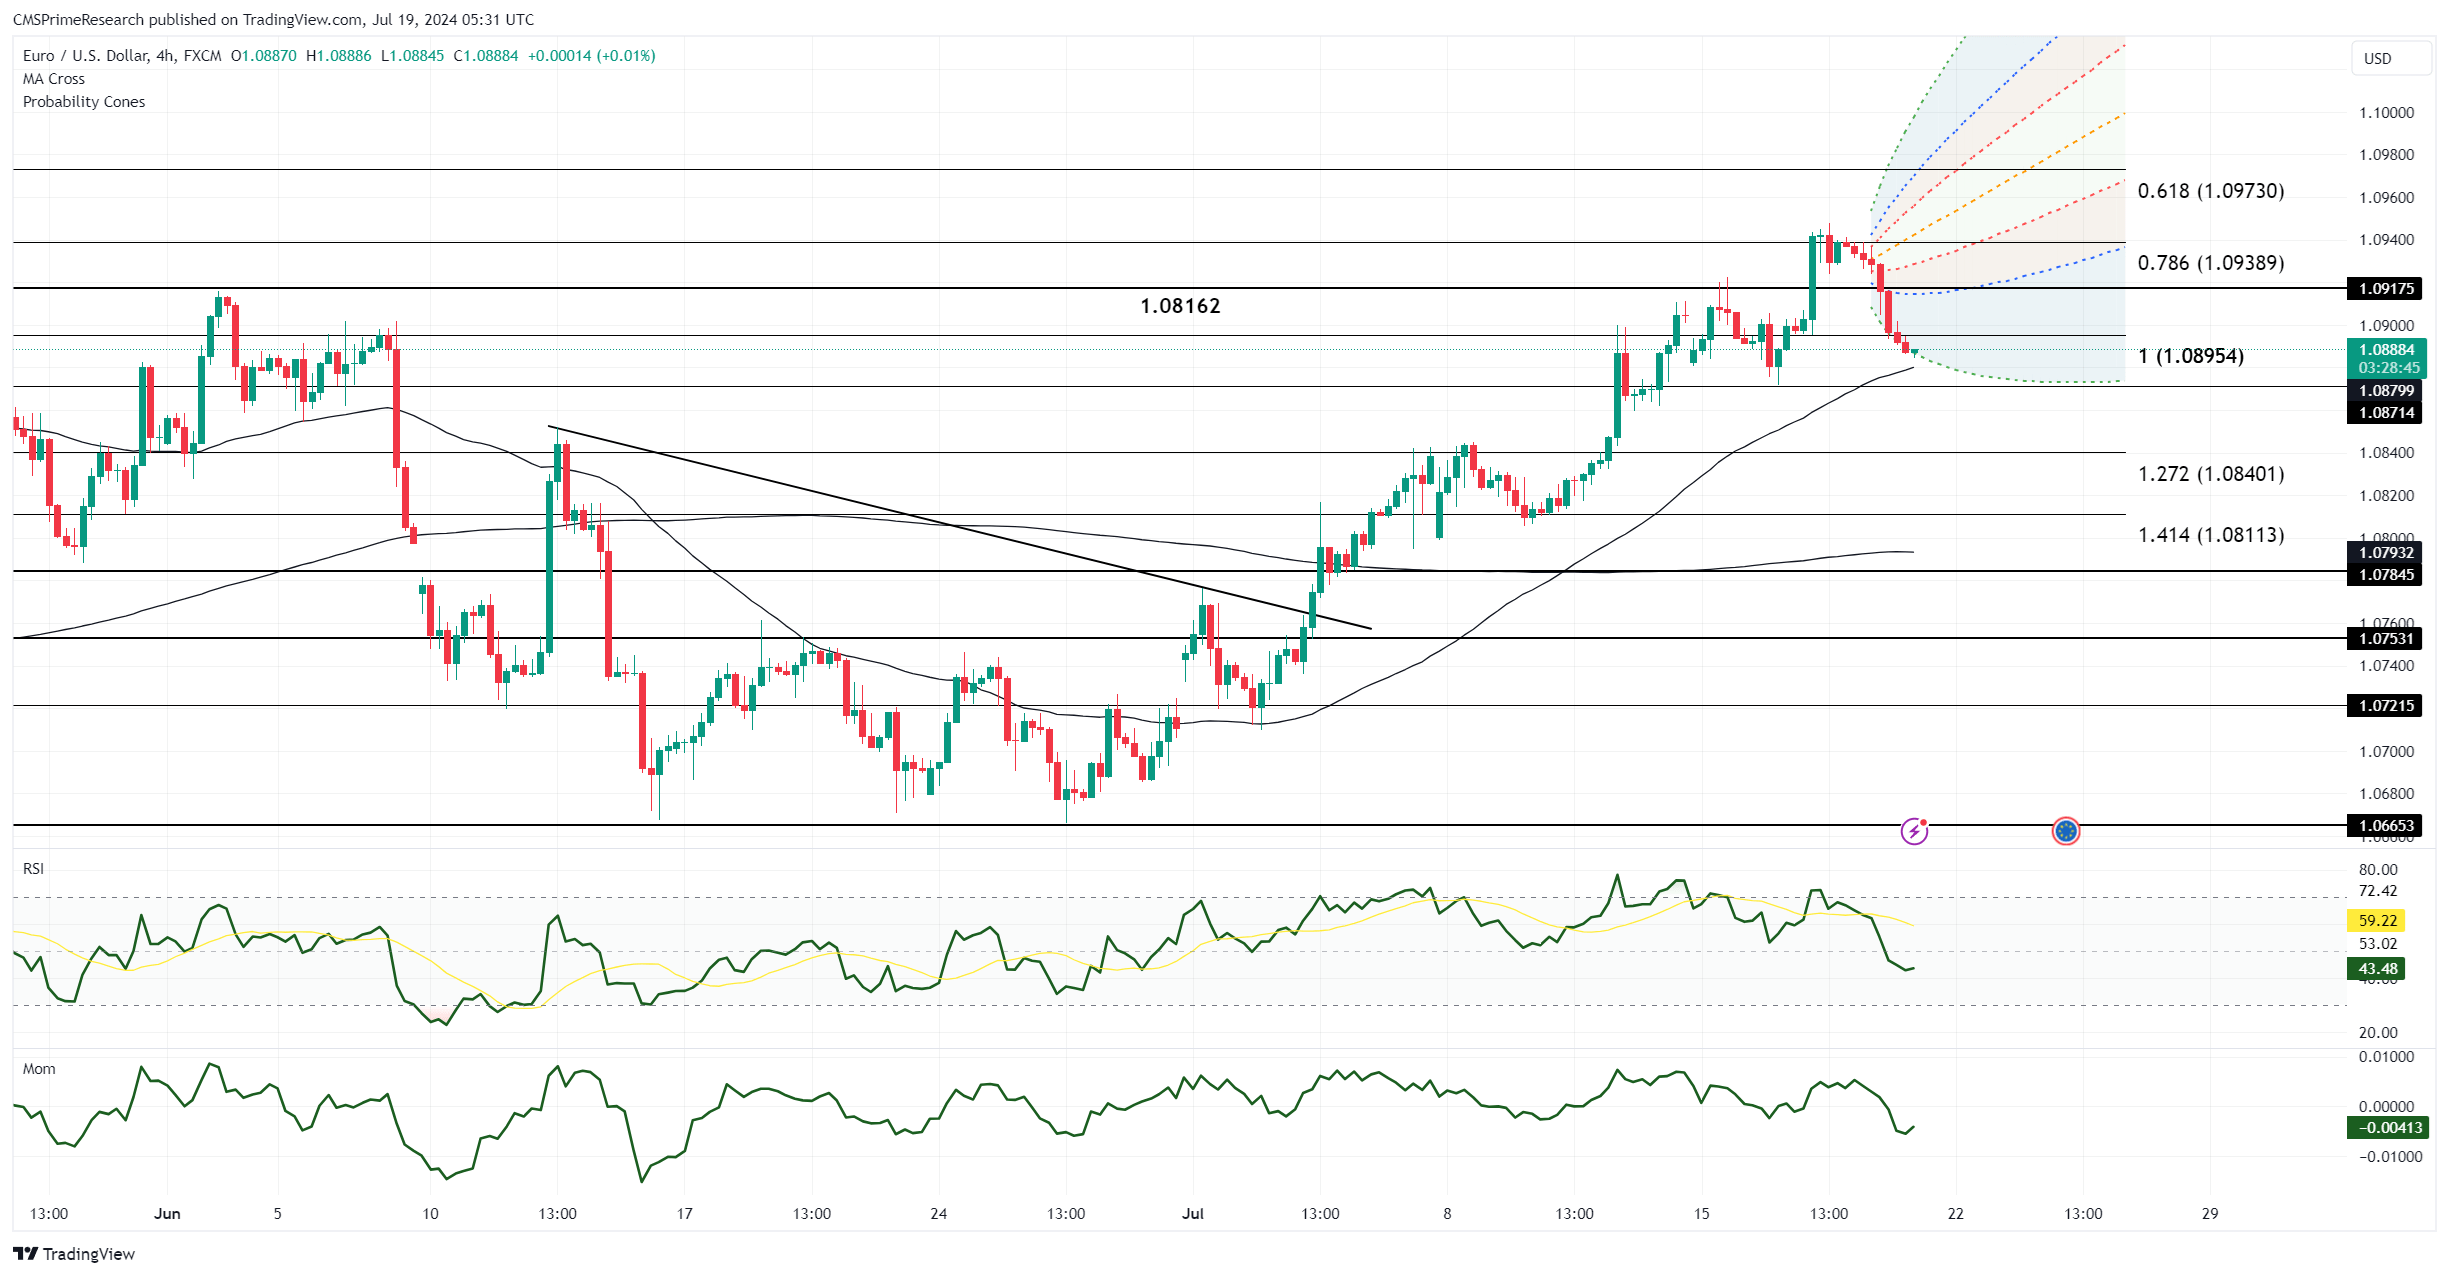
EUR/USD is currently trading with support at 1.0900 and resistance at 1.0982 (March 8th high) and 1.1000 (psychological level). The daily Relative Strength Index (RSI) is falling, suggesting potential consolidation of recent gains, while the monthly RSI is rising, indicating longer-term bullish momentum. The pair is holding above the 10-day moving average (10-DMA), which is a bullish signal. The 50-DMA and 200-DMA are also critical levels to watch for potential support and resistance.
Chart patterns indicate that EUR/USD is trading within an ascending channel, suggesting a bullish trend in the medium term. A break below the channel’s lower boundary near 1.0900 could signal a reversal or deeper correction. Additionally, the pair’s recent consolidation could be forming a bullish flag pattern, indicating a potential continuation of the uptrend if the resistance at 1.0982 and 1.1000 is breached.
Key levels to watch include short-term resistance at 1.0982 and 1.1000, and short-term support at 1.0900 and 1.0850. Long-term resistance is at 1.1050 (January 2022 high) and long-term support at 1.0800 (key psychological level). In the short term, EUR/USD may continue to consolidate between 1.0900 and 1.1000. A breakout above 1.1000 could pave the way for a move towards 1.1050 and beyond, while a break below 1.0900 could lead to a test of 1.0850 and potentially 1.0800.


