The EUR/USD currency pair has undergone a noticeable transformation in its market behavior as of November 17, 2023, shifting from a robust bullish trend to a phase of consolidation. The bullish phase, commencing on the 8th and extending until the 15th, was marked by a significant upward trajectory in prices, characterized by consecutive higher highs and higher lows. Following this bullish surge, the market entered a consolidation phase, featuring sideways price movements after the 15th.
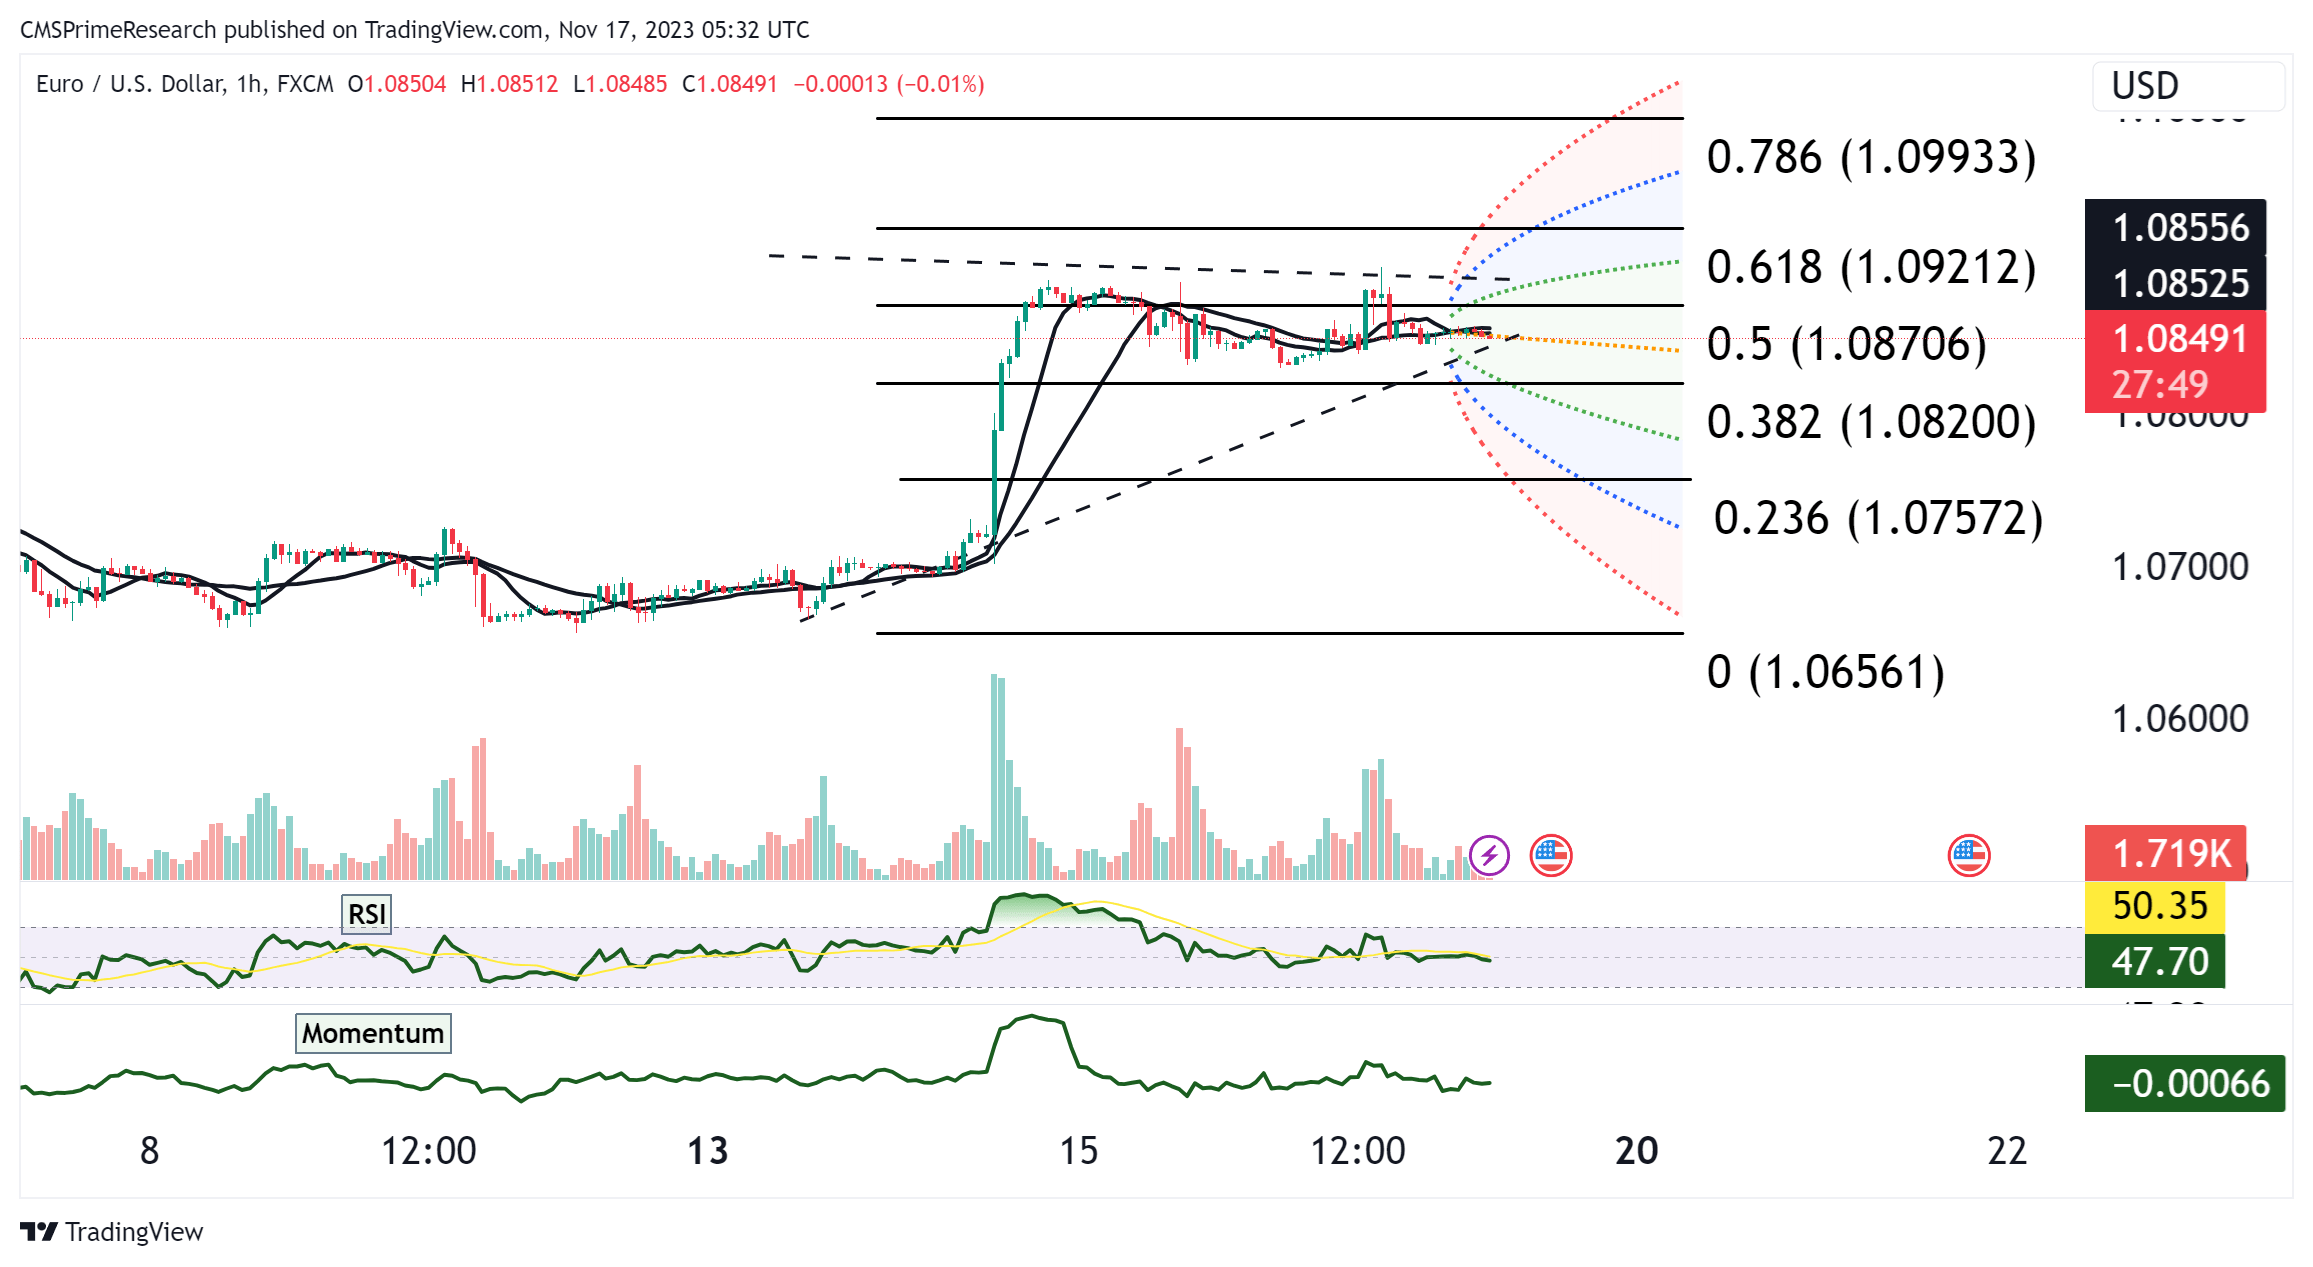
To assess potential support and resistance levels during this consolidation, Fibonacci retracement levels were applied, based on the range from the low to the high of the preceding bullish movement. These levels highlight key points at 1.07572 (0.236), 1.08200 (0.382), 1.08706 (0.5), 1.09212 (0.618), and 1.09933 (0.786).
Examining market indicators, the Relative Strength Index (RSI) hovering slightly above 50 and the Momentum indicator situated around the centerline align with the observed consolidation phase. These indicators collectively suggest a balanced market momentum. Volume analysis indicates spikes correlating with significant price movements, notably on the 15th, coinciding with the peak of the bullish trend.
The present market state for EUR/USD signifies equilibrium following the substantial upward trend. This phase of consolidation and neutrality is evident as the price hovers just below the 0.5 Fibonacci retracement level. Both the RSI and Momentum indicators affirm this equilibrium, indicating a harmonious balance between buyers and sellers. The future trend direction hinges on a breakout from this consolidation zone. Sustained movement above the 0.5 Fibonacci level could potentially lead to a retest of recent highs, while a break below may trigger further retracement towards lower Fibonacci levels. Vigilant monitoring of price action near these critical levels and the accompanying indicators is essential for gauging the short-term trend direction.