


 At present, the EUR/USD currency pair finds itself entrenched within a bearish zone coupled with a discernible range, with its current trading position residing at the 1.08160 level. This positioning is a clear indicator of the prevailing downward trend in the market, characterized by a range-bound movement.
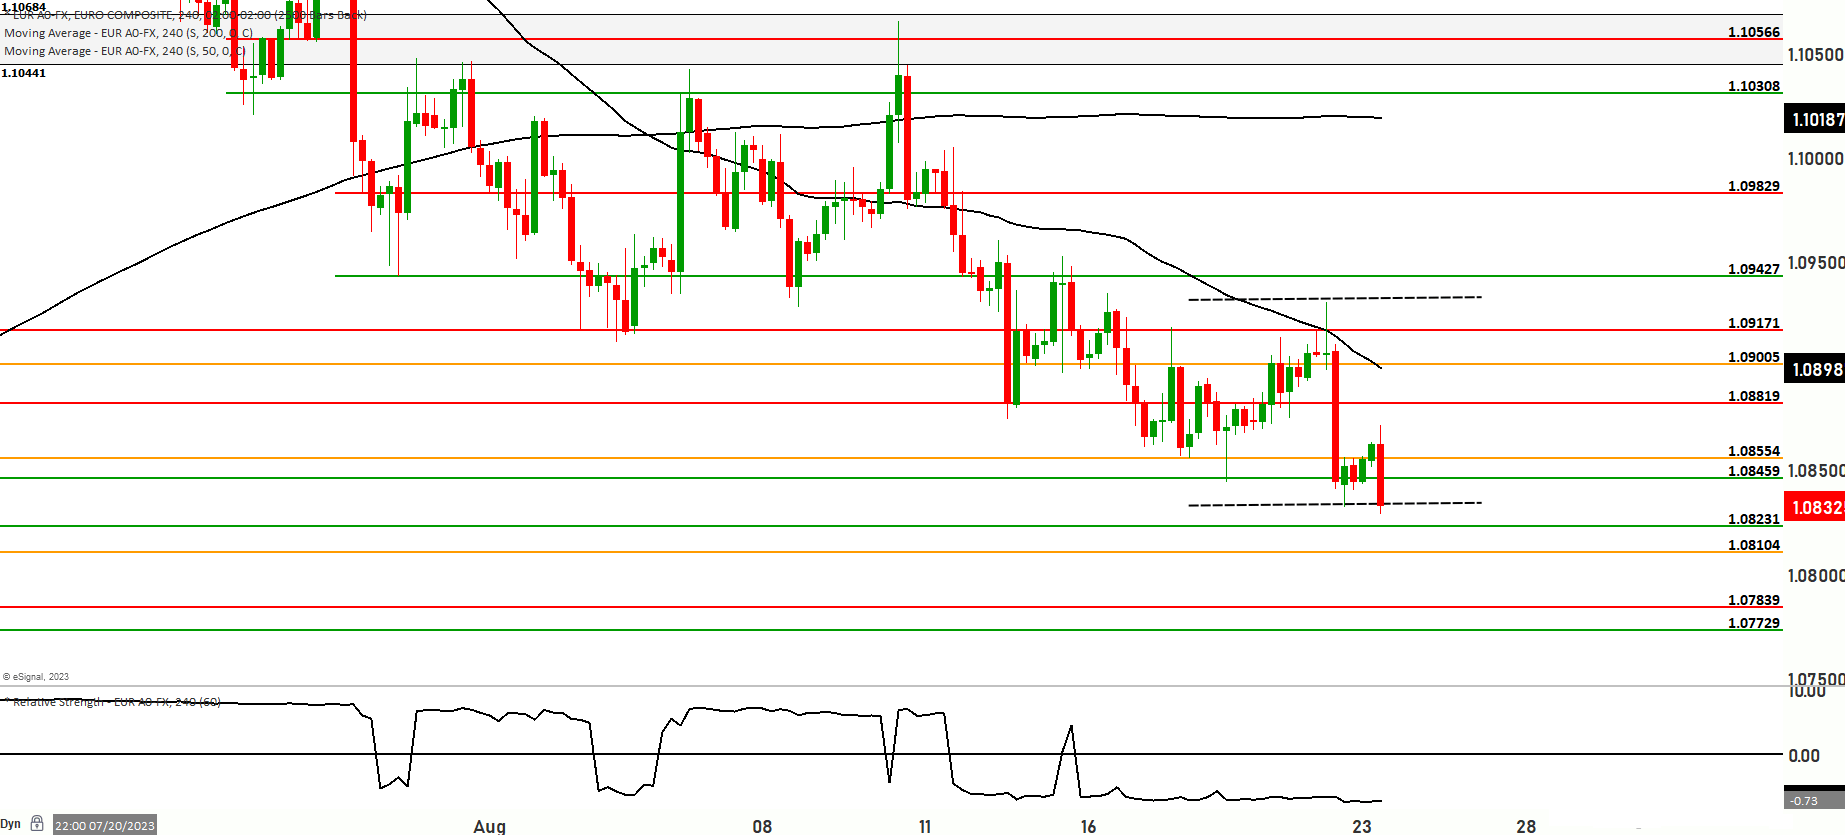
Adding weight to this bearish outlook is the positioning of the price beneath both the 200-day and 50-day moving averages. This alignment underscores the short-term bearish sentiment that prevails in the market, indicating a predisposition towards downward price movement within the established range.
Scenario 1: One plausible scenario involves the potential for the price to embark on an upward trajectory. Such an upward movement could potentially drive the price to challenge and test the levels within the range of 1.08658 to 1.08819
Scenario 2: Conversely, an alternate scenario envisions a potential decline in the price from its current position. This decline could lead to a retesting of support levels situated in the range of 1.08460 to 1.08366. Should the bearish sentiment gain further traction, it could result in a more pronounced downward movement, prompting the price to explore testing the levels between 1.08231 and 1.08104. In the event that the bearish momentum intensifies, there’s a possibility of the price plunging even lower, targeting the levels at 1.07838.
The prevailing momentum analysis for the market reflects its predominant bearish stance, signifying a range-bound sentiment that emphasizes the bearish trajectory. This assessment is further validated by the Relative Strength Index (RSI), which currently rests within the oversold territory. This oversold reading is suggestive of a limited-term bearish outlook.
In light of these dynamics, it’s prudent to consider the potential for the market to oscillate within a range. This range is delineated by the lowermost support level at 1.07838 and the uppermost resistance level at 1.09171. Observing how price reacts within this range will be pivotal in gauging the market’s short-term behavior and its potential foray into either further bearishness or potential bullish endeavors.