


USD/JPY – Bulls Falter at 148.12 Resistance; Near-Term Risks Tilt Lower
USD/JPY bulls faced significant headwinds during the latest trading session as a sharp rejection at the intraday high of 148.12 led to an abrupt pullback, underscoring waning bullish momentum near key resistance levels. The rejection was notably amplified by deteriorating risk sentiment, particularly in the U.S. technology sector, coupled with renewed weakness in oil prices. Both factors supported yen demand, causing a broader move lower across major yen crosses such as GBP/JPY and AUD/JPY, the latter slipping below its critical 55-day moving average at 95.36.
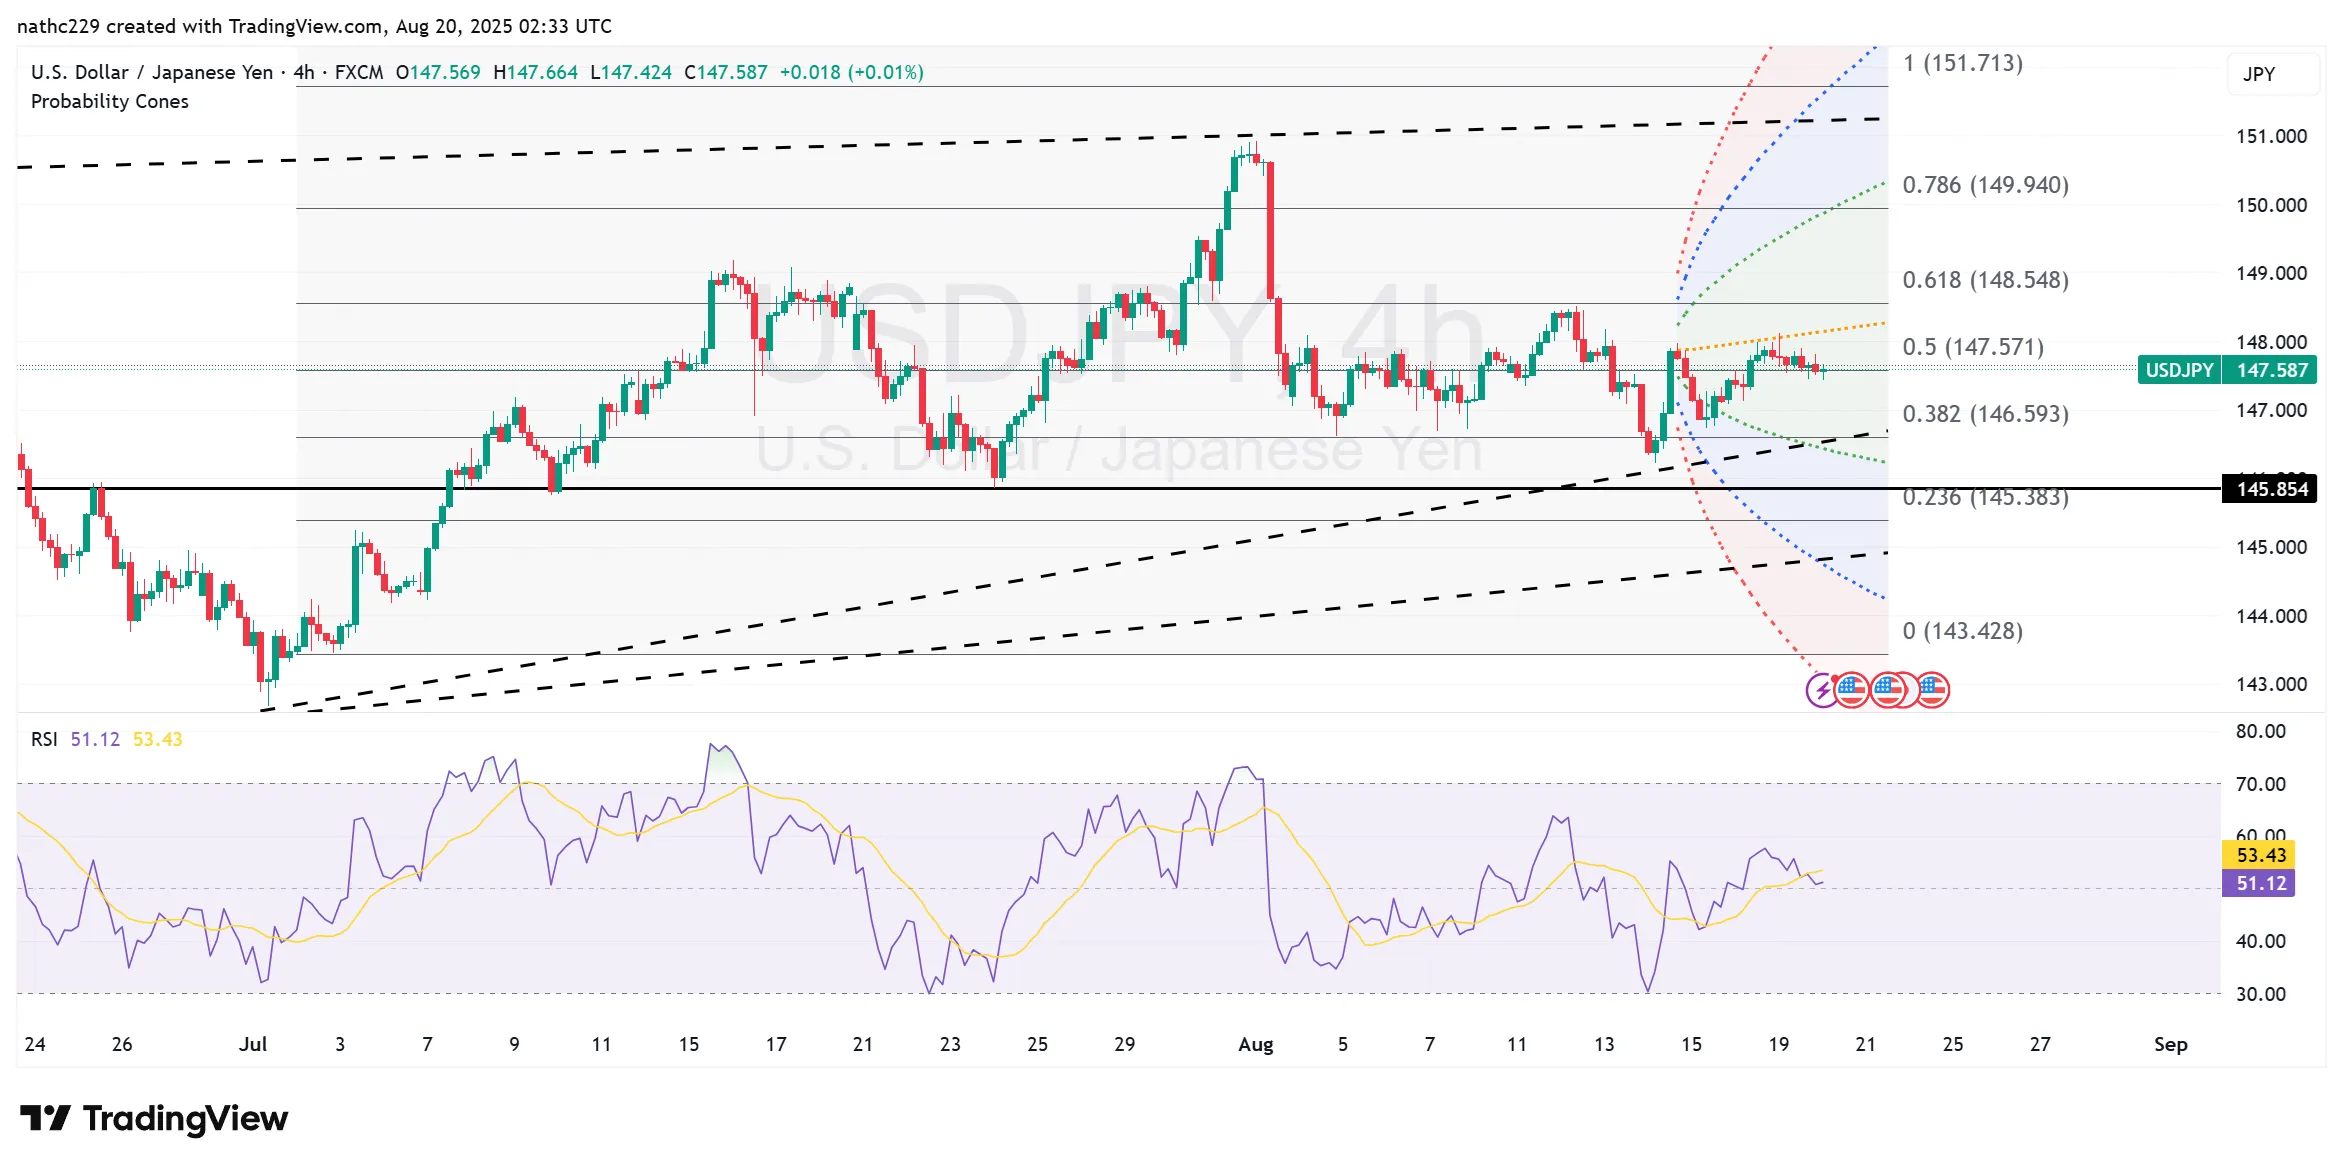
Technically, USD/JPY’s intraday failure to sustain levels above the pivotal 200-hour moving average (200-HMA), currently positioned near 147.75, adds credence to a developing bearish bias in the short term. The pair decisively broke below this key dynamic support, reaching session lows at 147.45 before stabilizing slightly. Immediate technical support now emerges at the Ichimoku conversion line at 147.43, which is acting as a near-term pivot.
Despite this bearish intraday reversal, short-term volatility indicators remain unusually subdued. One-week implied volatility for USD/JPY hovers around 6.8%, the lowest level seen since June 2024, signaling market complacency ahead of the highly anticipated Jackson Hole symposium. Similarly, risk reversals across short and medium-term maturities show limited concern about potential market-moving events in the immediate future.
Momentum indicators, however, highlight increased downside risks. The daily Relative Strength Index (RSI) has started to edge lower from near-overbought conditions, indicating waning upside momentum. The MACD histogram is flattening and approaching a potential bearish crossover, further confirming potential short-term downside risk.
Crucially, key support levels are well-defined on the daily chart. Initial minor support is established at the August 14 low near 146.22, closely aligned with the 55-day moving average currently situated around 146.38. Below this, significant structural support exists at the confluence of late June and July lows within the 145.86-146.00 zone. A decisive breach of this critical support cluster would suggest a deeper bearish scenario, possibly extending toward the 100-day moving average near 145.54.
On the upside, strong resistance is clearly delineated at the Ichimoku base line around 148.39, followed by the August 12 high at 148.64, and subsequently the prominent July 29 high at 148.81. A decisive breakout above this resistance cluster is necessary for bulls to regain confident control, potentially reigniting bullish momentum toward the psychological 150.00 barrier.
Looking ahead, traders should closely monitor key upcoming economic data, including Japan’s July trade data and June machinery orders. Additionally, geopolitical risks—especially comments from former President Trump regarding Russia and further developments at Jackson Hole—could significantly influence market sentiment. At present, the technical landscape suggests caution, as near-term bearish pressure intensifies unless bulls can swiftly reclaim levels above the 148.00-148.40 resistance band.