GBP/USD Analysis: Bullish Trends Amidst Global Dynamics and Key Economic Indicators

The GBP/USD pair has seen a notable uptick, largely influenced by broader market dynamics and specific economic indicators. The Yen and the Chinese Yuan have played a significant role in driving the USD lower, which has positively impacted the Sterling. This movement occurs amidst a backdrop of mixed performance in global stocks and commodities. In the UK, public sector wage growth in October has outpaced the private sector, indicating potentially higher domestic spending power, which could boost the economy.
The Bank of England’s Monetary Policy Report Hearings is a critical event for market participants, as it provides insights into the central bank’s views on the economy, which could influence future monetary policy decisions. There’s a general anticipation that a free-spending UK budget, set to be announced on Wednesday, might not be well-received by the markets, potentially creating volatility for the Sterling.
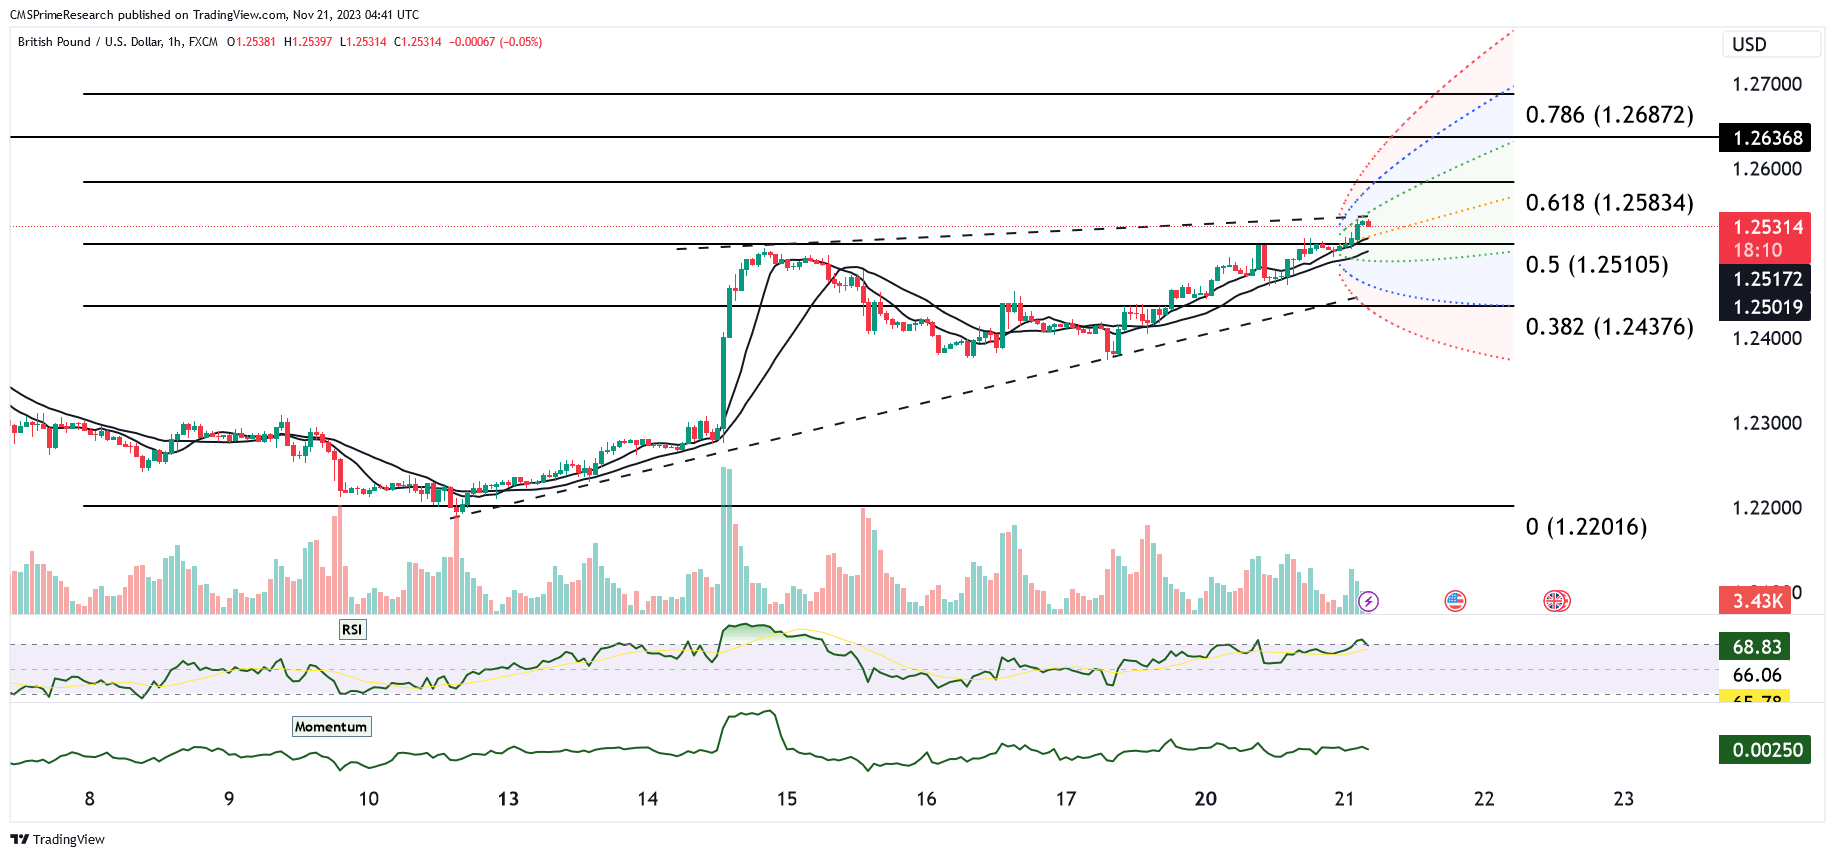
From a technical standpoint, the GBP/USD pair has been showing bullish signals. The currency pair has been trading above key daily moving averages (5, 10, and 21-day MAs), indicating an uptrend momentum. The expansion of the 21-day Bollinger bands suggests increased market volatility and a potentially stronger bullish trend. The pair has a longer-term target at 1.2590, which represents the 50% retracement of the July-October fall.
In recent trading sessions, the GBP/USD has been boosted, especially into the North American close, marking a 0.41% increase at 1.2509. The decline in U.S. Treasury yields in the North American afternoon further weighed on the USD, bolstering the Sterling. However, the pair continues to encounter resistance around the 1.25 level, closely aligned with the 100-day moving average. A firm close above this level would be a bullish indicator.
Looking ahead, resistance levels are identified at 1.2522 (upper 30-day Bollinger Band), 1.2548 (September 11 high), and 1.2619 (August 30 high). On the support side, key levels include 1.2448 (Monday’s low), 1.2446 (200-day moving average), and 1.2377/75 (November 16/17 lows). Traders are focusing on the upcoming Federal Reserve minutes on November 21 and UK flash PMIs on November 23, which are likely to influence the pair’s movement.
In conclusion, the GBP/USD pair presents a bullish trend in the short term, backed by fundamental factors such as public sector wage growth and monetary policy expectations. Technical indicators reinforce this outlook, although resistance around the 1.25 level poses a hurdle. Upcoming economic releases and central bank statements will be critical in determining the pair’s trajectory in the near future.
Key Levels to Watch: : 1.2383, 1.2625, 1.2600
| Levels | Support | Resistance |
|---|---|---|
| Level 1 | 1.2491 | 1.2558 |
| Level 2 | 1.2381 | 1.2600 |
| Level 3 | 1.2344 | 1.2656 |


