Skip links

Keltner Channel Trading Strategy for Profitability

Introduction:

Keltner Channel is a technical indicator based on volatility and can be used in detecting trends, reversals, and breakouts. It consists of three lines: a middle line (often a 20-period exponential moving average (EMA)), an upper band (usually set at 2 times the average true range (ATR) above the EMA), and a lower band (usually set at 2 times the ATR below

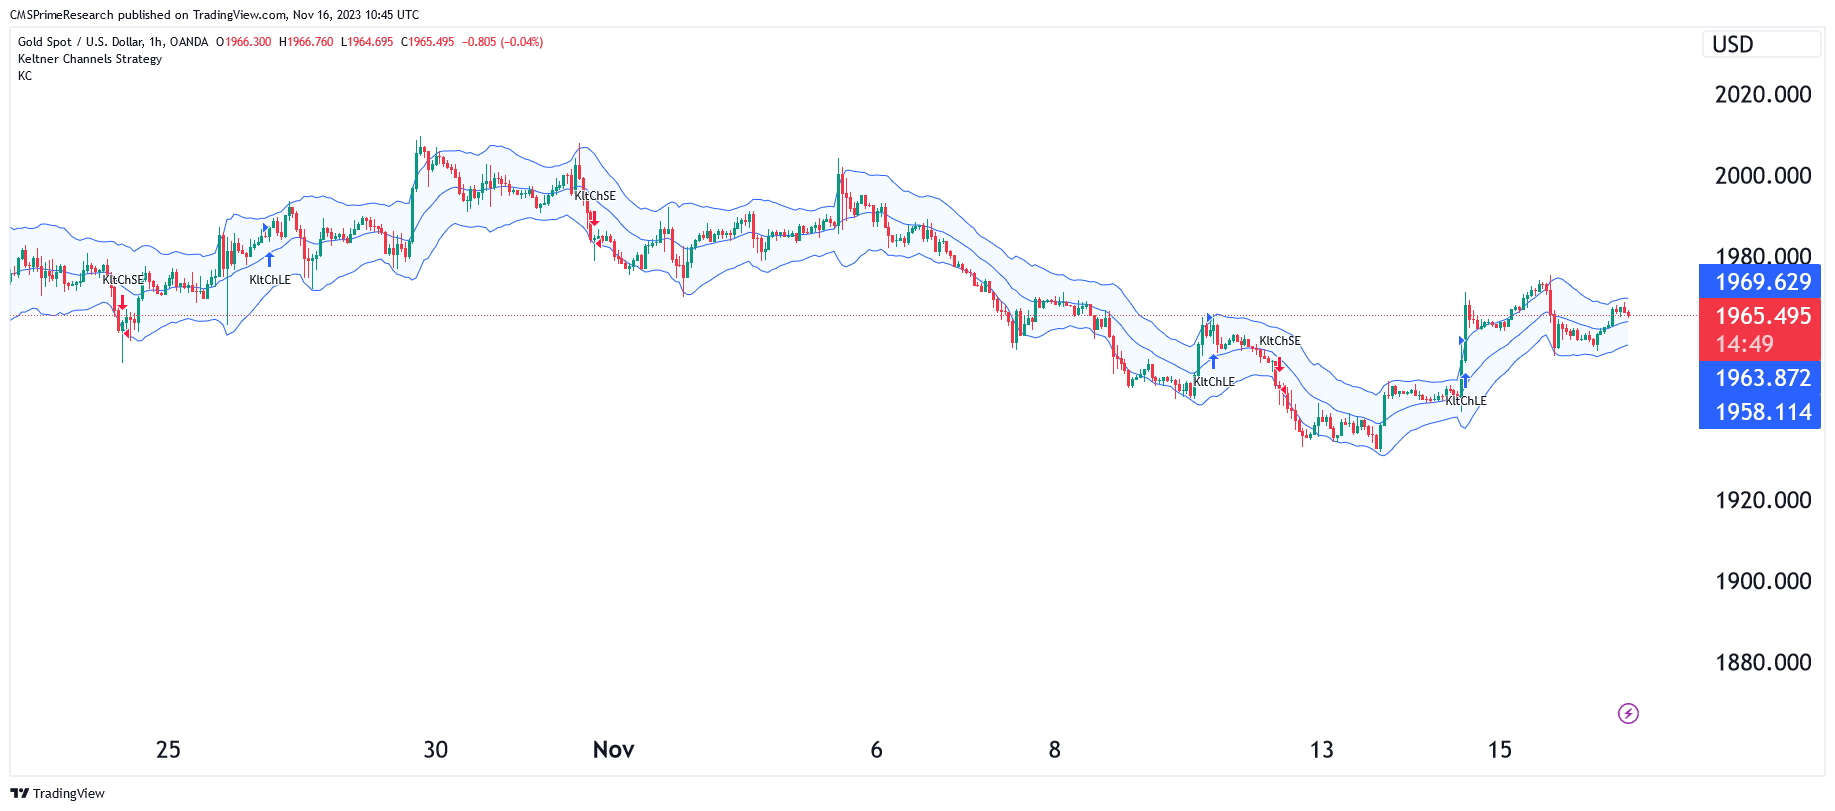
Here are some ways to use the Keltner Channel in your trading strategy:

1. Trend identification: Direction of a channel (up, down or sideways) may indicate the trend direction of the asset.

2. Breakout trading: If the price breaks above or below the channel and the channel starts to angle in the same direction, the trend may be signalling a new trend in the breakout direction, after a period of consolidation.

3. Reversal points: Reversals in prices are common, especially when markets form a high or a low structure. Such reversal is more likely to happen if the price closes outside the Keltner Channel and into key market structure.

4. Overbought and oversold levels: In a ranging market, the Keltner channel helps to identify overbought and oversold levels when the trend is flat. Overbought – if the price touches the upper band, oversold – if it touches the lower band.

5. Trend following: The price moves along the upper or lower limits in a very strong trend. The 20-period EMA can be helpful in timing your entry into a strong trend, either by buying the breakout or trading the pullback.

How is Keltner Channels Calculated?

A Keltner Channel has an EMA of 20 periods, but this can be changed as the trader prefers. The multiplier is usually a function of the upper and lower bands that are set twice the ATR above and below the EMA, depending on preferences.
The price becomes bullish as it touches the top Keltner Channel line, and bearish as it hits the lower Keltner Channel line. The direction of the channel (up, down, or sideways) can also help in ascertaining the direction of the trend of the asset.
Wider channels indicate high market volatility, which implies higher trading opportunities. On the other hand, more restricted channels imply a reduced volatility, which might suggest the absence of trading opportunities.
Nevertheless, it should be stressed that Keltner Channel can only indicate the trend direction and even give some signals for trading, but if we trade for long term, it should be combined with price action analysis, other technical indicators and fundamentals.
To calculate your Keltner channel, follow these steps:
1. Determine EMA for the asset, using last 20 periods or periods desired.
2. Determine ATR of the asset using the last 20 periods or the number of periods desired.
3. Take twice (or the chosen multiplier) from the ATR and then add it to the EMA value to get the upper band value.
4. To obtain the lower band value, multiply ATR by two (or desired multiplier) and then subtract that number from the EMA.
Be aware that the effectiveness of the Keltner Channels is heavily dependent on the settings used. The traders must then decide on what they want to do with the indicator and set it up.

Detecting Breakouts using Keltner Channels

Keltner Channels are a volatility-dependent technical indicator that could assist you in recognizing possible market breakouts. They consist of three lines: a median line (mostly, a 20-period exponential moving average (EMA)), an upper line (generally, twice the ATR above the EMA), and a lower line (usually, twice ATR under the EMA).

Here’s how you can use Keltner Channels to identify potential breakouts:
1. Monitor the channel direction: The direction of the channel (up, down, or sideways) will give you an idea of the asset’s trend direction. In a sideways trend, the price fluctuates within the high and low bands and may signal a breakout as the price moves beyond the bands.
2. Look for price breakouts: Breakout is an indicator that the price has moved above the upper band or below the lower band after a period of consolidation. It may also denote that a new trend has started to appear in the breakout direction after the channel angles in a certain direction.
3. Confirm the breakout: Using the Keltner channels in combination with other indicators, such as Momentum indicators like the Relative Strength Index or Moving Average Convergence Divergence, or Price Action or Candlestick patterns to improve the reliability of the breakout signal.

It is important to note that Keltner Channels are lagging indicator and it is possible that they may not predict future price movements precisely. Use additional confirmation tools, and proper risk management techniques to improve the reliability of the breakout signals.

Mistakes to Avoid when using Keltner Channels:

Traders should be aware of some common mistakes to avoid when using Keltner Channels for this purpose:

1. Relying solely on Keltner Channels: While Keltner Channels can help identify breakouts, they should not be used in isolation. Combining them with other technical indicators, such as momentum indicators like the Relative Strength Index (RSI) or Moving Average Convergence Divergence (MACD), can provide more reliable trading signals.

2. Ignoring the channel direction: The direction of the channel (up, down, or sideways) can help you identify the trend direction of the asset. Failing to consider the channel direction may lead to false breakout signals.

3. Not adjusting the settings: The default settings for Keltner Channels may not be suitable for all trading styles and market conditions. Adjusting the settings, such as the EMA period and the ATR multiplier, can help improve the accuracy of breakout signals.

4. Trading breakouts in low-volatility assets: Breakout strategies work best on assets with sharp trend movements. Attempting to trade breakouts on assets with low volatility and small price movements may result in a higher number of losing trades.

5. Not using proper risk management: As with any trading strategy, it’s essential to use proper risk management techniques, such as setting stop-loss orders and position sizing, to protect your capital in case the breakout signal turns out to be false.

By avoiding these common mistakes and combining Keltner Channels with other technical indicators and price action analysis, traders can improve their chances of successfully identifying and trading potential breakouts.

Back-testing Keltner Channels

Net Profit: The chart indicates a net profit of $4,882.20, which represents a 48.82% return. This suggests the trading strategy has been profitable over the period analyzed.

Total Closed Trades: There have been a total of 109 closed trades. This number tells us how many individual trading positions have been opened and closed.

Percent Profitable: The strategy has a success rate of 43.12%. This means that out of all trades made, 43.12% were profitable.

Profit Factor: The profit factor is 1.48. A profit factor greater than 1 indicates a profitable system, as it implies that the system made $1.48 for every dollar lost.

Max Drawdown: The maximum drawdown is $1,931.18, which is 13.17% of the account. This measures the largest peak-to-trough drop in the account’s value and is a metric for the risk taken by the trading strategy.

Average Trade: On average, each trade made a profit of $44.79, which is 0.25% of the account per trade. This gives an idea of how much each trade contributes to the total net profit.

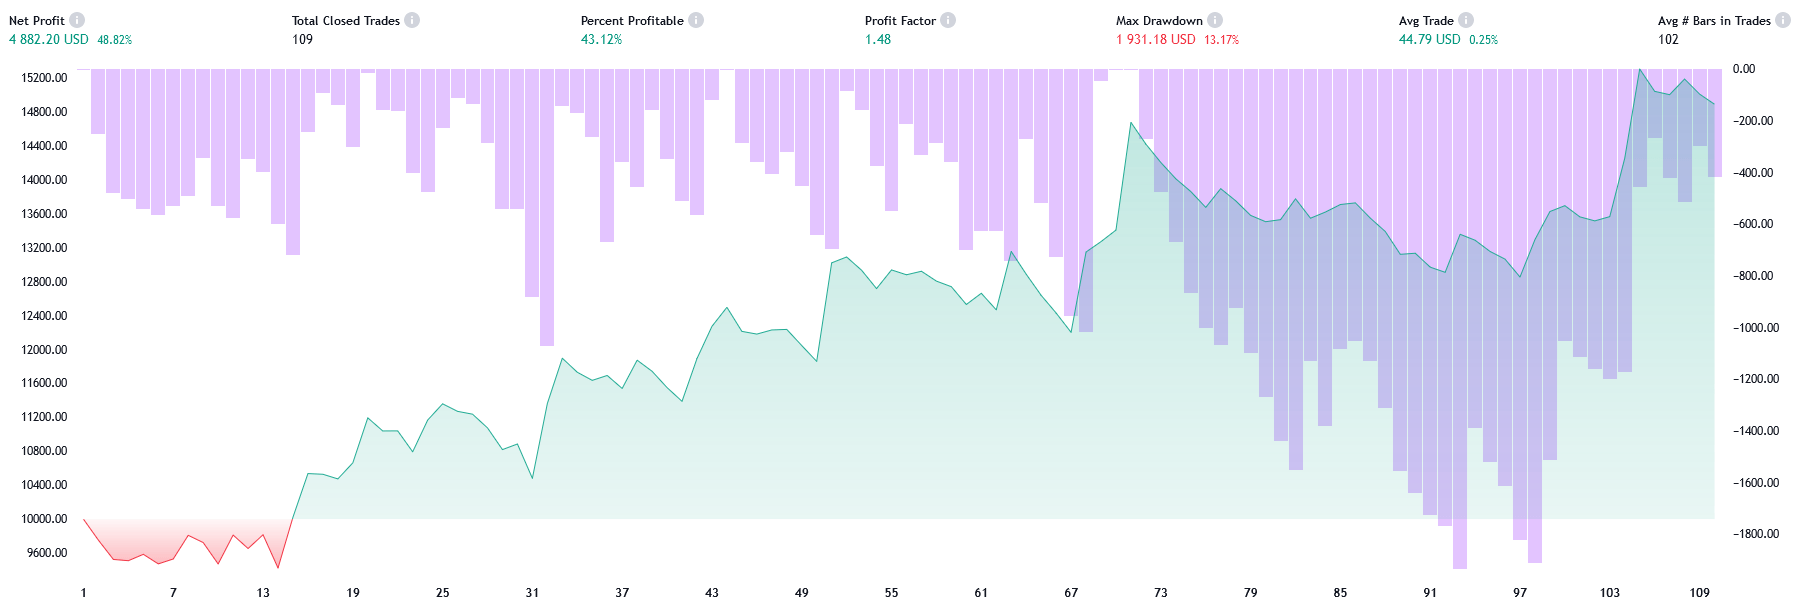
Equity Curve (green line with teal fill): This line graph represents the account balance over time. It starts just above $10,000, suggesting this may have been the initial account balance. The curve moves upwards, indicating growing equity, with some fluctuations showing the natural ups and downs of trading.

Drawdown Bars (purple bars with pink fill): These vertical bars represent the drawdown for each trade or a set of trades.

From this data, we can infer that while the trading strategy has had its fluctuations, overall it has been profitable over the period shown. The strategy has endured some risk, as indicated by the maximum drawdown, but has maintained a positive profit factor and net profit. The average profit per trade is relatively small compared to the account size, which suggests either a conservative strategy or one that aims for small, consistent gains rather than large, riskier returns. The number of trades and their duration could provide further insights into the trading frequency and holding periods for this strategy, but additional context, such as the trading instrument, the timeframe of the chart, and the specific trading strategy used, would be needed for a more comprehensive analysis.

Conclusion

To conclude, the exploration of the Keltner Channel Trading Strategy in this article illuminates its potential as a powerful tool in the trader’s arsenal. Its ability to leverage market volatility to discern trends, reversals, and breakout opportunities makes it indispensable for those seeking to navigate the complexities of the stock market with increased precision and confidence. We also emphasized the importance of understanding the underlying mechanics of the Keltner Channel—how it uses the Exponential Moving Average and the Average True Range to provide a nuanced view of market dynamics. We dissected various strategies, from trend following to breakout trading, highlighting how each approach can be tailored to different market scenarios.

However, the true value of the Keltner Channel lies not just in its theoretical framework, but in its practical application. By integrating this tool with other indicators and adhering to sound risk management practices, traders can enhance the reliability and profitability of their trading strategies. We also addressed common pitfalls in using the Keltner Channel, offering guidance on how to avoid these mistakes to ensure a more disciplined and informed trading approach. Whether it’s avoiding reliance on the channel in isolation or adjusting the settings to suit specific market conditions, these insights are vital for both novice and experienced traders alike.

In conclusion, the Keltner Channel Trading Strategy, with its multifaceted applications and adaptability, stands as a testament to the evolving nature of technical analysis in the stock market. As traders continue to seek out robust and effective strategies, the Keltner Channel remains a relevant and valuable tool, offering clarity and direction in the ever-shifting landscape of the financial markets.

Disclaimer: This is not an Investment Advice. Investing and trading in currencies involve inherent risks. It’s essential to conduct thorough research and consider your risk tolerance before engaging in any financial activities.