Skip links

Detecting Trend Persistence and Trend Capture through Technical Indicators using Regression

Introduction

Navigating through the ebbs and flows of the foreign exchange markets necessitates a meticulous exploration into the intricate dynamics that underpin currency valuations. This study pivots around the EUR/USD  currency pair, unraveling its multifaceted relationships with pivotal financial indicators through the lens of linear regression models. We take moving averages, momentum, volatility, and the relative strength index,as the study seeks to illuminate the subtle narratives and statistical relationships that help us to understand the currency pair’s trends, offering a nuanced glimpse into the mechanisms of trend persistence and capture in the ever-fluctuating Forex market.

We conducted 4 hypotheses, the research aims to understand the relationships between the aforementioned financial indicators and the closing prices of the EUR/USD. From understanding short-term and long-term price movements told by moving averages to analyzing  the signals of market sentiments understood by momentum and volatility, the research took 9 years worth of EUR USD Data , unearthing interesting insights into the currency pairs movement.

The Data and Variables

In this study we use the following Variables:

  1. Date

  2. Close: The closing price of the EUR/USD.

  3. MA200: The moving average over the last 200 Periods.

  4. MA50: The moving average over the last 50 Periods.

  5. RSI: The Relative Strength Index.

  6. MOM: Momentum of the currency pair.

  7. Average True Range: A measure of market volatility.

What kind of Hypothesis we aim to Find:

We use Close prices as the dependent Variable and Use the 4 Indicators as independent Variables. Below is the hypothesis we aim to find.

1. Moving Averages Hypothesis:
– H0: There is no relationship between the moving averages (MA50 and MA200) and the closing price.
– H1: There is a significant relationship between the moving averages (MA50 and MA200) and the closing price.

2. Volatility Hypothesis:
– H0: The Average True Range (a measure of volatility) does not affect the closing price.
– H1: The Average True Range has a significant effect on the closing price.

3. Momentum Hypothesis:
– H0: Momentum (MOM) does not have a significant impact on the closing price.
– H1: Momentum (MOM) has a significant impact on the closing price.

4. Strength Index Hypothesis:
– H0: The Relative Strength Index (RSI) does not influence the closing price.
– H1: The Relative Strength Index (RSI) has a significant influence on the closing price.

Detail Results of the Four Hypothesis:
The regression results for the Moving Averages Hypothesis  are:
Close=0.1372+1.1331×MA50−0.2549×MA200+ϵ

Where:

  • is the error term.
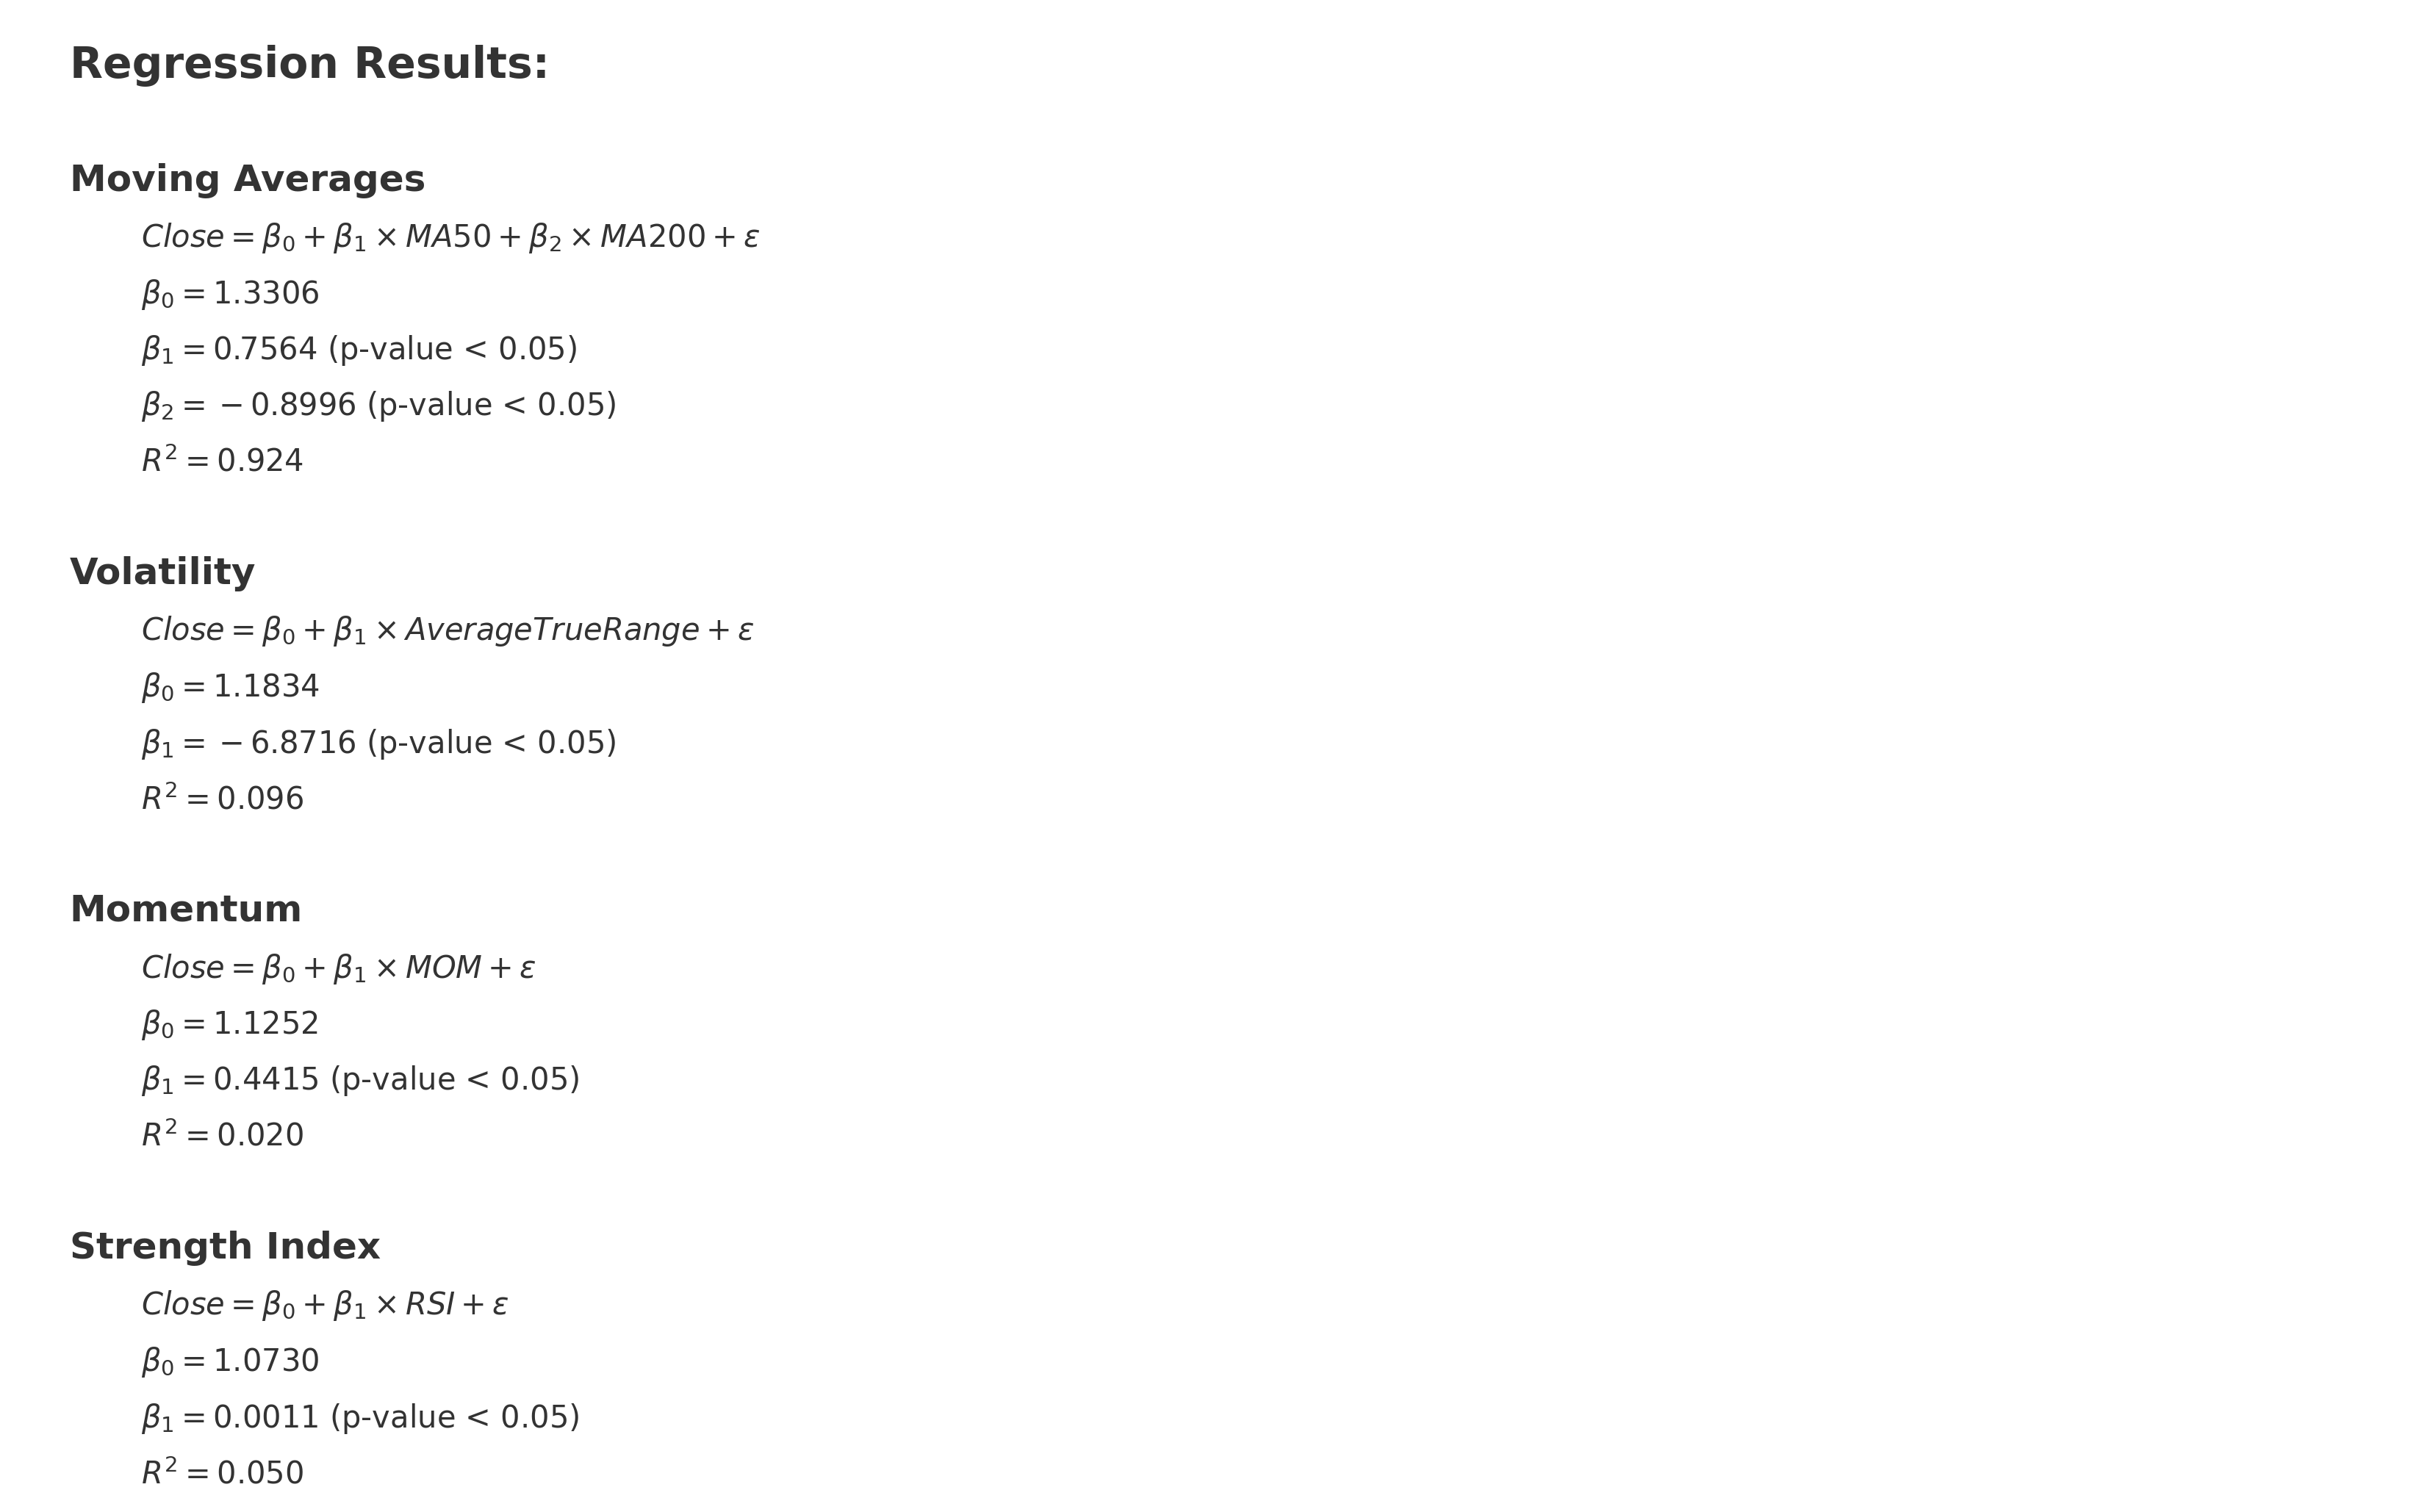
  • , indicating that approximately 87.6% of the variation in the closing price is explained by the model.

Regarding the p-values (P>|t|) for the coefficients:

  • The p-value for MA50 is 0.000, which is less than 0.05, indicating that MA50 is statistically significant in predicting the closing price.
  • The p-value for MA200 is also 0.000, which is less than 0.05, suggesting that MA200 is statistically significant in predicting the closing price.

Thus, we reject the null hypothesis H0 for both MA50 and MA200, accepting the alternative hypothesis H1 that states there is a significant relationship between the moving averages (MA50 and MA200) and the closing price.

The regression results for the Volatility Hypothesis are:
Close=1.1834−6.8716×Average True Range+ϵ

Where:

  • is the error term.
  • , indicating that approximately 9.6% of the variation in the closing price is explained by the model.

Regarding the p-value (P>|t|) for the coefficient:

  • The p-value for Average True Range is 0.000, which is less than 0.05, indicating that the Average True Range is statistically significant in predicting the closing price.

Thus, we reject the null hypothesis H0 for the Average True Range, accepting the alternative hypothesis H1 that states there is a significant relationship between the Average True Range and the closing price.

The regression results for the Momentum Hypothesis are:
Close=1.1252+0.4415×MOM+ϵ

Where:

  • is the error term.
  • , indicating that only about 2% of the variation in the closing price is explained by the model.

Regarding the p-value (P>|t|) for the coefficient:

  • The p-value for MOM is 0.000, which is less than 0.05, indicating that the Momentum (MOM) is statistically significant in predicting the closing price.

Thus, we reject the null hypothesis H0 for MOM, accepting the alternative hypothesis H1 that states there is a significant relationship between the Momentum (MOM) and the closing price.

The regression results for the Strength Index Hypothesis are:
Close=1.0730+0.0011×RSI+ϵ

Where:

  • is the error term.
  • , indicating that only about 5% of the variation in the closing price is explained by the model.

Regarding the p-value (P>|t|) for the coefficient:

  • The p-value for RSI is 0.000, which is less than 0.05, indicating that the Relative Strength Index (RSI) is statistically significant in predicting the closing price.

Thus, we reject the null hypothesis H0 for RSI, accepting the alternative hypothesis H1 that states there is a significant relationship between the Relative Strength Index (RSI) and the closing price.
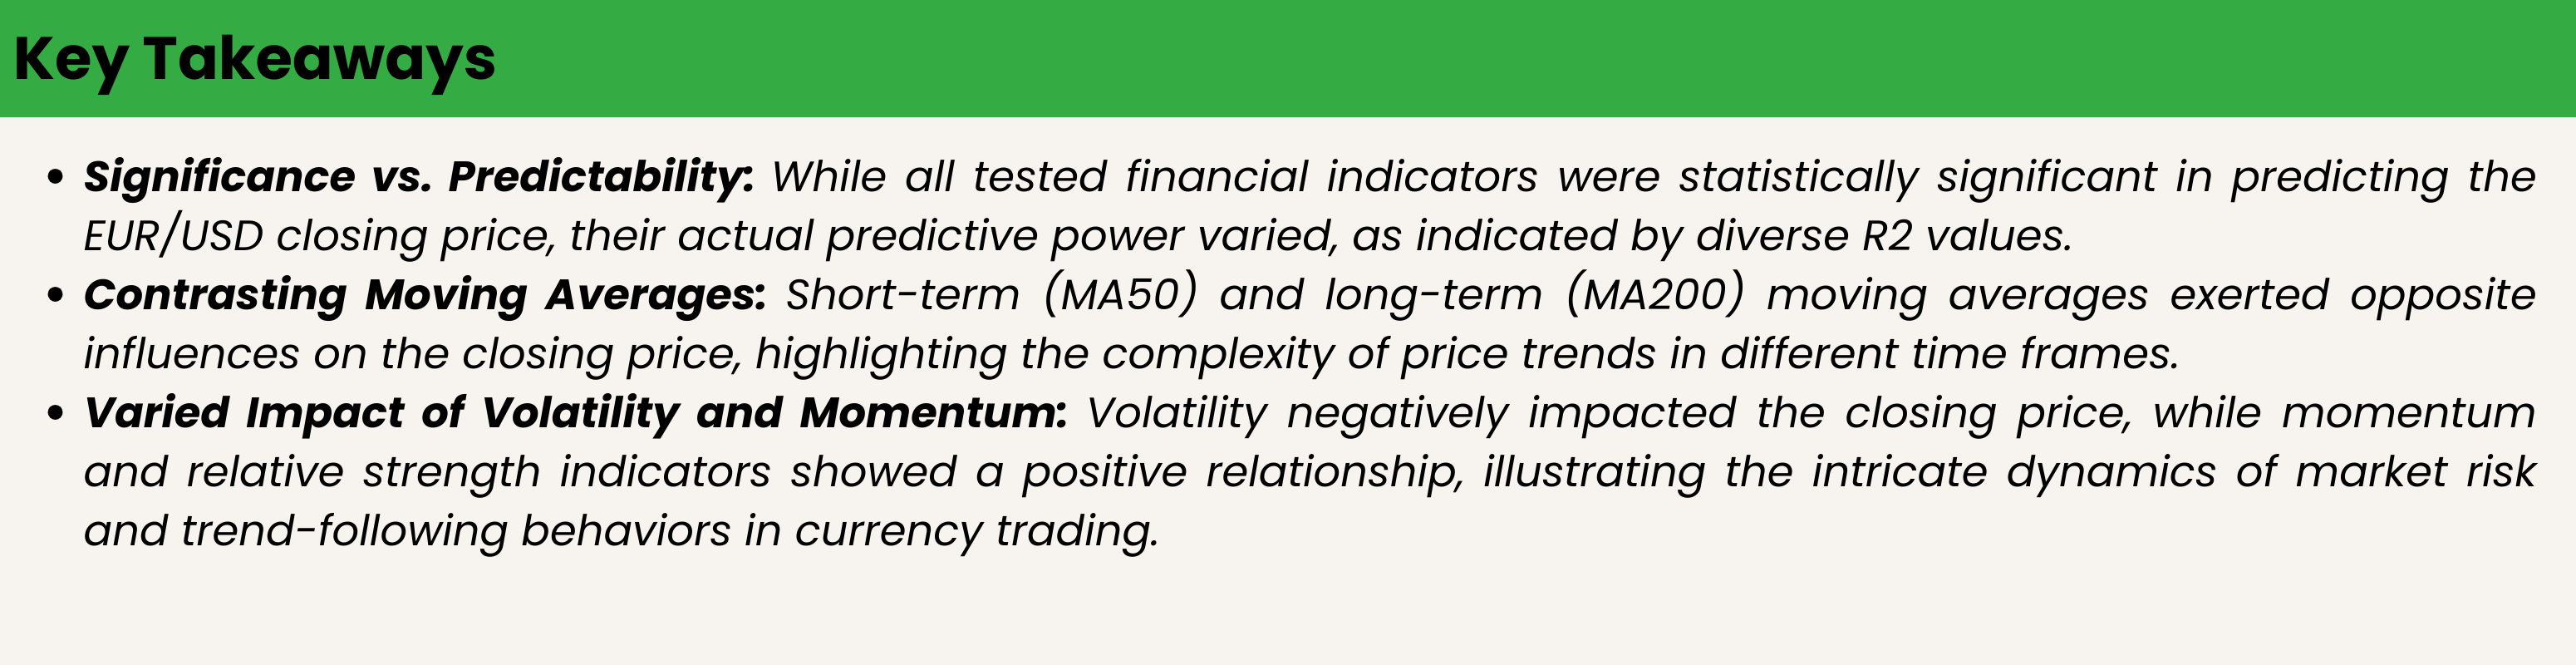
In Summary:
  • All the independent variables (“MA50”, “MA200”, “Average True Range”, “MOM”, and “RSI”) were found to be statistically significant in predicting the closing price based on the p-values obtained from the regression analyses.

  • However, the R2 values for the models (especially for “Average True Range”, “MOM”, and “RSI”) are quite low, suggesting that although the variables are statistically significant, they may not be strong predictors for the closing price.
Synopsis and Explanation of Findings

1. Moving Averages and Closing Price

The first hypothesis tested the relationship between moving averages (MA50 and MA200) and the closing price. The model unveiled a statistically significant relationship with both moving averages, rejecting the null hypothesis. The positive coefficient for MA50 and the negative coefficient for MA200 suggest that short-term and long-term trends exert opposite influences on the closing price. Specifically, short-term upward (downward) trends in price, reflected by MA50, tend to associate with an increase (decrease) in closing price. Conversely, long-term trends, embodied by MA200, exhibit an inverse relationship with the closing price. This dichotomy may underscore the market’s sensitivity to recent price movements while potentially correcting or regressing to longer-term trends.

2. Volatility and Its Impact

Volatility, quantified by the Average True Range, demonstrated a significant, albeit negative, relationship with the closing price, subsequently refuting the null hypothesis. This inverse relationship signifies that as market volatility escalates, the closing price experiences a downtrend, and vice versa. The rationale behind this could be tied to the risk-averse nature of investors; heightened volatility often engenders an environment of uncertainty, prompting traders to potentially withdraw, sell-off, or hedge their positions, thereby exerting downward pressure on the closing price.

3. Momentum’s Role in Price Movement

Momentum (MOM) also exhibited a statistically significant relationship with the closing price. Positive momentum, indicative of an ongoing upward price trajectory, was associated with an increase in the closing price. This positive relationship aligns with the theoretical underpinning of momentum investing, which posits that assets that have appreciated in the past tend to continue doing so in the future. This might be attributed to various factors like investor behavior, market psychology, or cascading effects from systematic trading strategies.

4. Relative Strength Index (RSI) and Closing Price

Lastly, the RSI, another pivotal indicator often utilized to identify overbought or oversold conditions, was found to be statistically significant in predicting the closing price. The positive coefficient suggests that as RSI increases (potentially moving towards an overbought condition), the closing price also ascends. This could be interpreted as the market being driven by momentum in the short term, with prices continuing to rise as buying pressure increases, even though the asset may be deemed ‘overbought’ according to the RSI.

Conclusion

While each of the examined variables exhibited statistical significance in predicting the closing price, it is imperative to acknowledge the varying degree to which they explain the variability in price (as indicated by R2 values). The findings underscore the multifaceted nature of financial markets, where price movements are impacted by an amalgamation of factors and conditions. Furthermore, while statistical relationships provide valuable insights, they do not necessarily imply causation, and thus, any trading or investment decisions should be bolstered by a comprehensive analysis, considering the broader economic and market context.

Disclaimer: This is not an Investment Advice. Investing and trading in currencies involve inherent risks. It’s essential to conduct thorough research and consider your risk tolerance before engaging in any financial activities.